A Serial Parallel Query

Sometimes parallel queries perform poorly due to bad luck. The parallel page supplier may distribute rows in a way that’s not optimal for performance. The hashing function used by SQL Server to split rows into threads may assign too many rows to a single thread. You may have seen some of these situations in production queries, but they can be hard to reproduce because they may depend on a lot of different factors including the complete data in some of the involved tables. This blog post demonstrates a technique to create demos that show how parallel thread imbalance can lead to poor performance.

Mapping Hash Partition Destination Threads

This work is inspired by a recent blog post at sql.sasquatch by my friend and colleague @sqL_handLe. For a given data type and DOP it appears that the same hashing function and thread boundaries are always applied, although I haven’t confirmed that. In other words, if an INT of value 1 in a parallel MAXDOP 4 query gets hashed to thread 2 in a query, then it may also get hashed to thread 2 from a different table in a different query. In other words, it appears to be possible to figure out ahead of time where different values will be hashed to. That means that it’s possible to construct a data set with very poor thread balance.

To create the mapping we need to construct a data set that makes it easy to tell which value gets sent to which thread. I inserted 20 distinct values into a table with each value having a row count equal to a different power of 2. Sample code to do this:

DROP TABLE IF EXISTS dbo.FIND_HASH_VALUES;

CREATE TABLE dbo.FIND_HASH_VALUES (
ID INT NOT NULL
);

DECLARE @start_num INT = 0;

INSERT INTO dbo.FIND_HASH_VALUES WITH (TABLOCK)
SELECT t.n
FROM
(
	SELECT v.n + @start_num AS n
	, ROW_NUMBER() OVER (ORDER BY v.n) RN
	FROM (
	VALUES
	  (1), (2), (3), (4), (5)
	, (6), (7), (8), (9), (10)
	, (11), (12), (13), (14), (15)
	, (16), (17), (18), (19), (20)
	) v(n)
) t
CROSS APPLY (
	SELECT TOP (POWER(2, -1 + t.RN)) 1 dummy
	FROM master..spt_values t1
	CROSS JOIN master..spt_values t2
) ca
OPTION (MAXDOP 1);

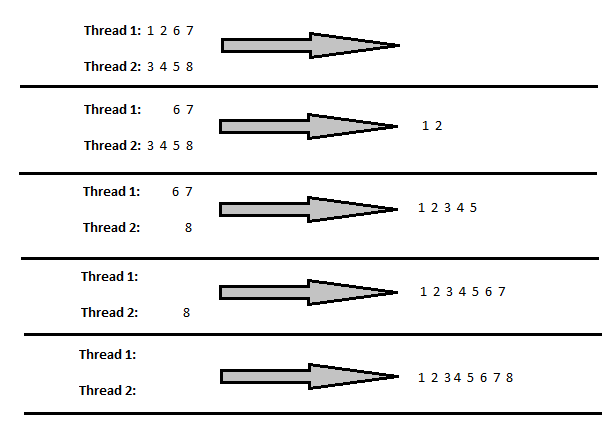
The above code runs in about a second on my machine. To see which value goes to which thread I need a query with a repartition streams operator that has the hash partitioning type. One way to get this is with window functions. The following query naturally goes parallel on my machine and has the operator that I’m looking for:

SELECT TOP 1
  ID
, COUNT(*) OVER (PARTITION BY ID) CNT
FROM FIND_HASH_VALUES
OPTION (MAXDOP 4);

The TOP 1 isn’t essential. It’s there to limit the size of the result set. The query finishes quickly and rows are sent to all four threads:

a15_threads

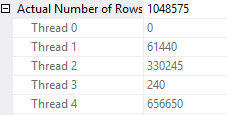
Decoding which value went to which thread can be done in SQL Server using the & operator. The query below finds the thread number for the 20 distinct values in the table:

DECLARE
@start_num INT = 0,
@thread1 INT = 61440,
@thread2 INT = 330245,
@thread3 INT = 240,
@thread4 INT = 656650;

SELECT t.ID
, cast(@thread1 & t.bit_comp as bit)
+ 2 * cast(@thread2 & t.bit_comp as bit)
+ 3 * cast(@thread3 & t.bit_comp as bit)
+ 4 * cast(@thread4 & t.bit_comp as bit) AS THREAD
FROM
(
	SELECT v.n + @start_num AS ID
	, POWER(2, -1 + ROW_NUMBER()
		OVER (ORDER BY v.n)) bit_comp
	FROM (
	VALUES
	  (1), (2), (3), (4), (5)
	, (6), (7), (8), (9), (10)
	, (11), (12), (13), (14), (15)
	, (16), (17), (18), (19), (20)
	) v(n)
) t;

Here’s the result set:

a15_bitmap_results

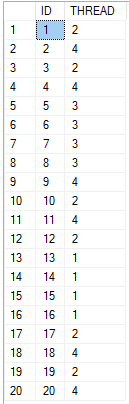
Getting the mapping for other ranges of IDs is as simple as changing the variables for both queries. I put the first 100 values on pastebin in case it’s useful for someone.

The Data Set

For demo purposes I want a table that contains values that will always hash to the same thread at MAXDOP 4. You can find 25 values that hash to the same thread in the pastebin. In the table below I insert 100k rows for each unique value that goes to thread 1:.

DROP TABLE IF EXISTS dbo.SKEWED_DATA;

CREATE TABLE dbo.SKEWED_DATA (
ID INT NOT NULL,
FILLER VARCHAR(50)
);

INSERT INTO dbo.SKEWED_DATA WITH (TABLOCK)
SELECT t.n, 'Lamak'
FROM
(
	SELECT v.n
	FROM (
	VALUES
	  (13), (14), (15), (16)
	, (30), (31), (32), (33)
	, (46), (47), (48), (49), (50)
	, (63), (64), (65), (66)
	, (80), (81), (82), (83)
	, (97), (98), (99), (100)
	) v(n)
) t
CROSS APPLY (
	SELECT TOP (100000) 1 dummy
	FROM master..spt_values t1
	CROSS JOIN master..spt_values t2
) ca
OPTION (MAXDOP 1);

CREATE STATISTICS S ON dbo.SKEWED_DATA (ID) WITH FULLSCAN;

The Query

The business requirement of the day is to take the first 2.5 million rows from the SKEWED_DATA table, calculate the row number partitioned by ID, and to return all rows with a row number greater than 100k. The query will never return any results based on how data was inserted into the table. Here is one way to express such a query:

SELECT ID, FILLER
FROM
(
	SELECT
	  ID
	, FILLER
	, ROW_NUMBER() OVER (PARTITION BY ID
		ORDER BY (SELECT NULL)) RN
	FROM
	(
		SELECT TOP (2500000)
		    ID
		  , FILLER
		FROM dbo.SKEWED_DATA
	) t
) t2
WHERE t2.RN > 100000
OPTION (MAXDOP 4);

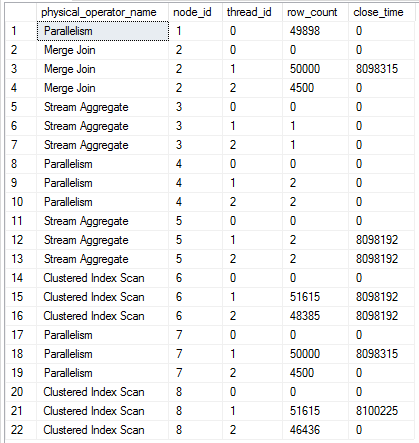
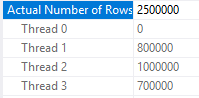
The query runs at MAXDOP 4 but does not benefit from parallelism at all. All of the rows are sent to the same thread:

a15_terrible_parallel_query

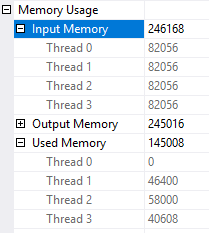
The sort spills to tempdb because the memory grant for the sort is split evenly across all four threads. Threads 2-4 don’t get any rows so 75% of the memory grant is wasted:

a15_memory

I ran the query five times and it executed in an average of 2816 ms. CPU time was generally pretty close to the elapsed time. This is a very bad example of a parallel query.

Lowering DOP

The query above is designed to not be able to take advantage of parallelism. The useless repartition streams step and the spill to tempdb suggest that the query might perform better with a MAXDOP 1 hint. With a MAXDOP 1 hint the query runs with an average time of 2473 ms. There is no longer a spill to tempdb.

What happens if the query is run with MAXDOP 3? Earlier I said that the hashing function or thread boundaries can change based on DOP. With MAXDOP 3 I get a much more even row distribution on threads:

a15_good_threads

The better distribution of rows means that the spill to tempdb does not happen either:

a15_good_memory

The query definitely seems like it could benefit from parallelism. After five runs it had an average execution time of 1563 ms, almost a 50% improvement over the MAXDOP 4 query. The ratio of CPU time to elapsed time is also much more in line with what we might expect from a good parallel query:

CPU time = 3219 ms, elapsed time = 1574 ms.

Final Thoughts

It was fun to construct a query that runs faster when MAXDOP is lowered from 4 to 3. Hopefully the details were interesting in of themselves. Thanks for reading!

Advertisement

Hash Partitioned Exchange Spills

This blog post contains a few demos for generating hash partitioned exchange spills. It does not attempt to explain why performance is so bad in some cases, but I think that the behavior here is simply interesting to observe. Note that all of the demos were done on SQL Server 2016 SP1 CU4. Some of this may not be reproducible on other versions.

Order Preserving Streams

First I need to say a few words about repartition and gather streams operators. Here’s an example of one:

a14_operator

These operators are easy to misunderstand. Even when they have an “order by” they do not directly do a sort in the traditional sense. Instead, they rely on the ordered input threads to produce 1 or more ordered output threads. There’s no memory grant associated with them. For an illustration of how this could work, consider a very simple example with 4 rows on two threads:

a14_order_preserving

After the first step, values 1 and 2 from thread 1 are processed. There is a switch to thread 2 that moves 3, 4, and 5, and so on. This all explained in a much better way by Paul White in his talk on parallelism at the 2013 PASS Summit:

What is an Exchange Spill?

As usual, the good stuff is hidden in extended event descriptions:

Occurs when the memory communication buffers for a query with multiple Parallelism operators become full, resulting in one of the operators writing to TempDB. If this happens multiple times in a single query plan the query performance is impacted. Use this event in conjunction with any of the *_showplan events to determine which operation in the generated plan is causing the exchange spill using the node_id field

According to Paul White, one way to get a deadlock is when the buffers are full but there aren’t any rows on one of the threads. There is a brilliant demo that involves partitioning by round robin near the end of the talk that starts here:

This blog post focuses on deadlocks that occur with hash partitioning.

The Test Query

Only one table is needed to see exchange spills caused by hash partitioning. The first column stores the ID used for the join and the second column is used to pad out the pages. The clustered index isn’t a primary key to allow for duplicate values. Table definition:

DROP TABLE IF EXISTS DEADLOCK;

CREATE TABLE DEADLOCK (
	ID BIGINT NOT NULL,
	FLUFF VARCHAR(100)
);

CREATE CLUSTERED INDEX CI__DEADLOCK ON DEADLOCK (ID);

The query that I’ll run forces a parallel merge join with varying MAXDOP:

SELECT t1.ID
FROM DEADLOCK t1
WHERE EXISTS (
       SELECT 1
       FROM DEADLOCK t2
       WHERE t1.ID = t2.ID
)
ORDER BY t1.ID
OPTION (QUERYTRACEON 8649, MERGE JOIN, MAXDOP 2);

With this query, we can force an order preserving repartition streams to be hashed against a column with as few distinct values as we like. Note that there is an element of chance to this. For some data distributions a deadlock may not always occur. The performance of the same query can vary to an extreme degree as well.

Getting a Deadlock

One way to see a deadlock is by putting 50k rows into the table with four distinct values for ID:

TRUNCATE TABLE DEADLOCK;

INSERT INTO DEADLOCK WITH (TABLOCK)
SELECT
  (RN - 1) / 12500
, REPLICATE('Z', 100)
FROM (
       SELECT TOP (50000) ROW_NUMBER()
		OVER (ORDER BY (SELECT NULL)) RN
       FROM master..spt_values t1
       CROSS JOIN master..spt_values t2
	   CROSS JOIN master..spt_values t3
) t
OPTION (MAXDOP 1);

UPDATE STATISTICS DEADLOCK CI__DEADLOCK WITH FULLSCAN;

Running the SELECT query from before with MAXDOP 2 seems to pretty reliably produce a deadlock. The query typically takes around 7 seconds to run at first but it usually finishes much quicker after the deadlock checker has woken up. The deadlock can be seen with the exchange_spill extended event or by the tempdb spill in the repartition streams operator:

a14_deadlock

Putting the Dead in Deadlock

Some queries have extremely variable performance. They can run for seconds, minutes, hours, or even longer than a day. They can eventually be killed by the deadlock monitor. I had one such query running for longer than 24 hours, but apparently Microsoft got embarrassed and killed SSMS:

a14_SSMS

There are many ways to see this behavior. Inserting alternating 0s and 1s seems to do the trick:

TRUNCATE TABLE DEADLOCK;

INSERT INTO DEADLOCK WITH (TABLOCK)
SELECT
  RN % 2
, REPLICATE('Z', 100)
FROM (
       SELECT TOP (100000) ROW_NUMBER()
		OVER (ORDER BY (SELECT NULL)) RN
       FROM master..spt_values t1
       CROSS JOIN master..spt_values t2
	   CROSS JOIN master..spt_values t3
) t
OPTION (MAXDOP 1);

UPDATE STATISTICS DEADLOCK CI__DEADLOCK WITH FULLSCAN;

The first 49000 rows or so are displayed fairly consistently in SSMS. After that the query slows to a crawl. It only used 140 ms of CPU time after five minutes of execution. I wasn’t able to get this query to finish on my machine, but other similar queries finished after many hours. The data in sys.dm_exec_query_profiles is interesting:

a14_dmv

Assuming a packet size of 4500 rows, the scan at node id 8 is just one packet away from finishing. Thread 1 for the repartition streams is finished along with thread 1 of the merge join. All 50k rows with a value of 0 have been processed by the merge join but only 49898 rows made it to the gather streams at the end of the plan. I’ve seen this kind of behavior with the performance issue that affects some parallel queries with a TOP operator.

All six rows from sys.dm_os_waiting_tasks have a wait type of CXPACKET. There are resource descriptions of WaitType=e_waitPortClose. Ultimately, it’s not clear to me why this query appears to run “forever”, but one way or another it should eventually finish.

Final Thoughts

The same behavior can be seen in 2017 RC2. I couldn’t get either of the two example queries to finish on that version. Some of my test cases don’t cause deadlocks in 2016 SP1 CU2. It appears that Microsoft has done work in this area with negative consequences for some data distributions. A theory for why this happens can be found here. Microsoft appears to have fixed this in 2016 SP1 CU6. Thanks for reading!

Dumping Call Stacks

If you’re like me, you’ve seen people posting information found through debugging SQL Server and thought “Yeah, I could be that cool”. If you want to see call stacks but failed to get anywhere with the debugger then this post might be for you. It contains step-by-step instructions for viewing SQL Server call stacks by creating a minidump.

What is a Minidump?

I will borrow a definition from Thomas Kejser’s blog post:

What is a dump? It is a file containing a snapshot of the running process – and parts or all of the memory space of that process. The snapshot also contains the call stack of every thread the process has created.

That last sentence is relevant to our interests. We can use minidumps to generate small files that contain SQL Server call stacks. Note that if you aren’t careful you can end up writing the full contents of memory to a dump file. I believe that writing the file is a single-threaded process, so this can take hours and hundreds of GBs on a real server. Also SQL Server is frozen while the dump is happening, so don’t do it in production.

Dumps are most useful when you want to examine a long running, very simple query or a query that seems to be stuck at a certain point. They aren’t useful to see a full call stack of a non-simple query or to see something that happens just once during execution, like a specific task during query compilation. All that you can get is a snapshot and the snapshot may not contain the information that you’re looking for.

There are multiple ways to generate and read dump files. For this blog post I’ll be using sqldumper.exe and WinDbg.

Using sqldumper.exe

First go to the directory that contains sqldumper.exe. On my machine for SQL Server 2016 the directory is C:\Program Files\Microsoft SQL Server\130\Shared . Open an admin command prompt and point it to that directory. Here are the arguments that we need to look at call stacks:

C:\Program Files\Microsoft SQL Server\130\Shared>sqldumper
Usage: sqldumper [ProcessID [ThreadId [Flags[:MiniDumpFlags] [SqlInfoPtr [DumpDir

There are many ways to get the ProcessID for SQL Server. One way is to run the following SQL query:

SELECT SERVERPROPERTY('PROCESSID');

At the time of writing this post I have a process ID of 2364.

If ThreadId is set to 0 you’ll get information about all threads, including system threads that you might not be interested in. Sometimes you can get everything that you’re interested in by looking at a single thread for serial queries, or at a single thread if a parallel query appears to be throwing too much work at that thread. There’s probably a better way to write this query, but the query that I use to find the thread that I’m interested in is below:

SELECT th.os_thread_id, wta.wait_type
FROM sys.dm_os_threads th
INNER JOIN sys.dm_os_workers w
	ON th.worker_address = w.worker_address
INNER JOIN sys.dm_os_tasks tk
	ON w.task_address = tk.task_address
INNER JOIN sys.dm_os_waiting_tasks wta
	ON wta.waiting_task_address = tk.task_address
where tk.session_id = 56;

wait_type is there to give a clue about which threads are interesting. More columns can be added to the query as needed.

The Flags parameter controls which information is written to the dump file. There are many options and some of them write the full contents of memory to disk. The most useful ones that I’ve found are 0x0120 (dump minimal information about all threads) and 0x0100 (dump information about a single specified thread).

I always set SqlInfoPtr to 0 and don’t care to know what it does.

DumpDir is where the dump files are written to. Point it to your preferred place for leaving dumps, like Erik’s doorstep.

Getting the Call Stack

If your dump is successful then you’ll end up with a .mdmp file. This can be opened with your favorite debugging program. I use WinDbg because there are instructions for it and I generally don’t know what I’m doing. Open the program and go to File -> Open Crash Dump. Open your file and type the magic command:

~*kn

After a short while you’ll see call stack information:

a13_magic

As far as I can tell, you have to close and reopen the program in order to open a new crash dump file. This is unfortunate, but it makes viewing the call stack that much sweeter.

Insert Example

Let’s start with a simple example. How do call stacks differ when inserting into a heap vs a clustered index? For the source data I’ll put 2 GB of pages into a clustered index:

DROP TABLE IF EXISTS dbo.source_ci;

create table dbo.source_ci (
	ID BIGINT NOT NULL,
	FILLER VARCHAR(7777) NOT NULL,
	PRIMARY KEY (ID)
);

INSERT INTO source_ci WITH (TABLOCK)
SELECT TOP (250000)
	ROW_NUMBER() OVER (ORDER BY (SELECT NULL))
	, REPLICATE('Z', 7777)
FROM master..spt_values t1
CROSS JOIN master..spt_values t2;

Here’s the definition for the target table with a clustered index:

DROP TABLE IF EXISTS dbo.target_ci;

create table dbo.target_ci (
	ID BIGINT NOT NULL,
	FILLER VARCHAR(7777) NOT NULL,
	PRIMARY KEY (ID)
);

And here’s the query that I want to get a dump of:

INSERT INTO dbo.target_ci WITH (TABLOCK)
SELECT *
FROM dbo.source_ci WITH (TABLOCK);

I previously wrote the source data to source_ci in order to make the insert query into target_ci as simple as possible. I want to maximize the chances that the call stack associated with the step of inserting rows into the table is present in the dump file. If the query to select the data for the insert is too complicated then I might not get what I’m looking for when I take a snapshot.

I started the insert, identified the thread of interest (8324), and dumped information for the single thread:

C:\Program Files\Microsoft SQL Server\130\Shared>sqldumper 2364 8324 0x0100 0 c:\sql_dumps
Parsed parameters:
    ProcessID = 2364
    ThreadId = 8324
    Flags = 0x100
    MiniDumpFlags = 0x1160
    SqlInfoPtr = 0x0000000000000000
    DumpDir = c:\sql_dumps
    ExceptionRecordPtr = 0x0000000000000000
    ContextPtr = 0x0000000000000000
    ExtraFile = <NULL>
    PatternForExtraFiles = <NULL>
    InstanceName = <NULL>
    ServiceName = <NULL>
Remote process didn't specify a dump file name
Target suspended
Callback type 11 not used
Callback type 15 not used
Callback type 7 not used
MiniDump completed: c:\sql_dumps\SQLDmpr0024.mdmp
Total Buffer pool data pages filtered out: 0 KB
Total Hekaton data pages filtered out: 0 KB
Total Free memory (from non top level allocators) filtered out: 0 KB
Total top level free memory filtered out: 0 KB
Total Log pool memory filtered out: 0 KB
Location of module 'dbghelp.dll' : 'C:\Program Files\Microsoft SQL Server\130\Shared\dbghelp.dll'
File version of module 'C:\Program Files\Microsoft SQL Server\130\Shared\dbghelp.dll' : '6.12:2.633'
Product version of module 'C:\Program Files\Microsoft SQL Server\130\Shared\dbghelp.dll' : '6.12:2.633'
Location of module 'sqldumper.exe' : 'C:\Program Files\Microsoft SQL Server\130\Shared\SqlDumper.exe'
File version of module 'C:\Program Files\Microsoft SQL Server\130\Shared\SqlDumper.exe' : '2015.130:1601.5'
Product version of module 'C:\Program Files\Microsoft SQL Server\130\Shared\SqlDumper.exe' : '13.0:1601.5'
Watson Invoke: No

I did the same thing with a heap target table (with a MAXDOP 1 hint), and diffed the call stacks:

a13_call_stacks

Some of the function names are the same, which makes a lot of sense. We’re reading from the same source table. Of course there are differences as well. For example, for the heap we see sqlmin!CHeapBuild::InsertRow+0x151 and for the clustered index we see sqlmin!CIndBuild::InsertRow+0xd84. That’s pretty neat.

Stuck Query Example

For the next example I’ll use my favorite query that never finishes. First we need to create a few tables:

DROP TABLE IF EXISTS dbo.TestDriver;

CREATE TABLE dbo.TestDriver
(
    n integer NOT NULL,
    n2 integer NOT NULL
);

-- 100k rows
INSERT dbo.TestDriver WITH (TABLOCK) (n, n2)
SELECT TOP (100000)
CHECKSUM(sv1.number, NEWID()), CHECKSUM(sv1.number, NEWID())
FROM master.dbo.spt_values AS SV1
CROSS JOIN master.dbo.spt_values AS SV2
OPTION (MAXDOP 1);

DROP TABLE IF EXISTS dbo.TestCCI;

CREATE TABLE dbo.TestCCI
(
    n integer NOT NULL,
    INDEX ccsi CLUSTERED COLUMNSTORE
);

-- 10 M rows
INSERT dbo.TestCCI WITH (TABLOCK) (n)
SELECT TOP (10 * 1000 * 1000)
CHECKSUM(sv1.number, NEWID())
FROM master.dbo.spt_values AS SV1
CROSS JOIN master.dbo.spt_values AS SV2
CROSS JOIN master.dbo.spt_values AS SV3
OPTION (MAXDOP 1);

The following query seemingly runs forever:

SELECT CA.x
FROM
(
    SELECT TOP (1) n2
    FROM dbo.TestDriver
    ORDER BY n ASC, n2 DESC
) AS T1 (id2)
CROSS APPLY
(
    SELECT COUNT_BIG(*)
    FROM dbo.Test AS T2
    WHERE T2.n <= T1.id2
) AS CA (x);

Viewing a call stack could be helpful once you’ve exhausted the usual ways of trying to figure out why the query isn’t finishing. If I run the query to get thread information I see that os_thread_id 4176 has a wait type of CXPACKET (zzzzz) and os_thread_id 3076 has a wait type of HTBUILD. Time to take a dump:

sqldumper 2364 3076 0x0100 0 c:\sql_dumps

After running the magic command:

ntdll!NtSignalAndWaitForSingleObject+0x14
KERNELBASE!SetHandleCount+0x1f850
sqldk!SOS_Scheduler::Switch+0x106
sqldk!SOS_Scheduler::SuspendNonPreemptive+0xd3
sqlmin!EventInternal<SuspendQueueSLock>::Wait+0x1e7
sqlmin!CSyncPoint::WaitAtNthGate+0x1ac
sqlmin!CSyncPoint::Wait+0x13e
sqlmin!CBpSpillProcessor::Main+0xf8
sqlmin!CBpQScanHashAggNew::BpGetNextBatch+0x52
sqlmin!CQScanBatchHelper::GetRow+0x97
sqlmin!CQScanNLJoinTrivialNew::GetRow+0x12c
sqlmin!CQScanProfileNew::GetRowImp<0>+0x11d
sqlmin!CQScanXProducerNew::GetRowHelper+0x63
sqlmin!CQScanXProducerNew::GetRow+0x15
sqlmin!FnProducerOpen+0x5b
sqlmin!FnProducerThread+0x7a9
sqlmin!SubprocEntrypoint+0x10ab
sqldk!SOS_Task::Param::Execute+0x231
sqldk!SOS_Scheduler::RunTask+0xaa
sqldk!SOS_Scheduler::ProcessTasks+0x3cd
sqldk!SchedulerManager::WorkerEntryPoint+0x2a1
sqldk!SystemThread::RunWorker+0x8f
sqldk!SystemThreadDispatcher::ProcessWorker+0x2de
sqldk!SchedulerManager::ThreadEntryPoint+0x1d8
kernel32!BaseThreadInitThunk+0x14
ntdll!RtlUserThreadStart+0x21

Now you can write even more detailed connect items that will never get fixed!

Final Thoughts

Now you can impress your friends with call stacks, as long as you have easily impressed friends. Thanks for reading!