SQL Server 2017 CU14 Change to CCI Insert Memory Time-out Behavior

A KB article was recently published that suggested that memory time-out behavior was changed for CCI inserts:

When you try to create a Columnstore Index on a table in Microsoft SQL Server 2016 or 2017, the request may fail after 25 seconds with memory time-out error 8645, depending on how many memory consuming queries are running concurrently and/or how much memory is available at the time of the request. The memory time-out error may occur even when you configure longer memory request time-out at an instance level or at a resource pool level.

I’ve never seen that error occur for serial inserts. Serial inserts time out after 25 seconds and execute with minimum required memory. They write directly to the delta store instead of attempting compression. So it looked like this change affects parallel inserts but the details weren’t at all clear to me.

Time out for time-outs

Why should we care about memory grant timeouts for CCI insert queries? Simply put, lots of bad things can happen when those queries can time out, both for serial and for parallel inserts. For serial insert queries, I’ve observed deadlocks, extremely poor performance along with long SLEEP_TASK waits, and extremely long rollbacks. For parallel insert queries, I’ve observed queries that run seemingly forever, poor performance of the SELECT part, and error 8645. You probably don’t want any of that occurring in production. It would be very helpful if it was possible to extend the 25 second time-out for queries that insert into columnstore tables.

Time out for time-outs

I’ve found it extremely useful to keep around a 2017 RTM environment with no CUs to figure when issues related to columnstore were introduced into the product. First we’ll take a look at the behavior on 2017 RTM to see error 8645 in action. I want a relatively simple parallel insert query that will run for longer than 25 seconds and will take a large memory grant. I decided on the following query:

INSERT INTO dbo.TARGET_CCI_1 WITH (TABLOCK)
SELECT ca.SLOW, ca.INFLATE_GRANT
FROM (VALUES (0), (1), (2), (3)) v(x)
CROSS APPLY (
	SELECT TOP (1048576) sc.SLOW, sc.INFLATE_GRANT
	FROM dbo.SLOW_TO_COMPRESS sc
	WHERE sc.FOR_SEEKING = v.x
) ca
OPTION (MAXDOP 2);

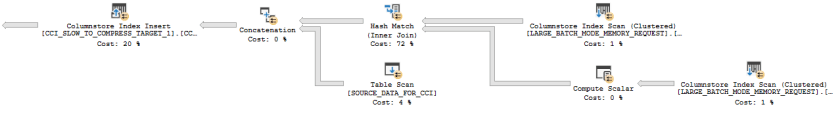
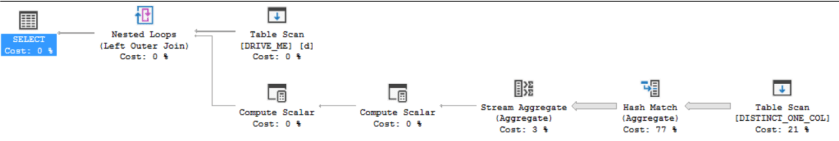
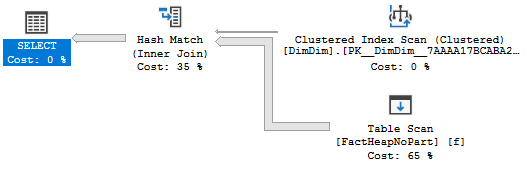
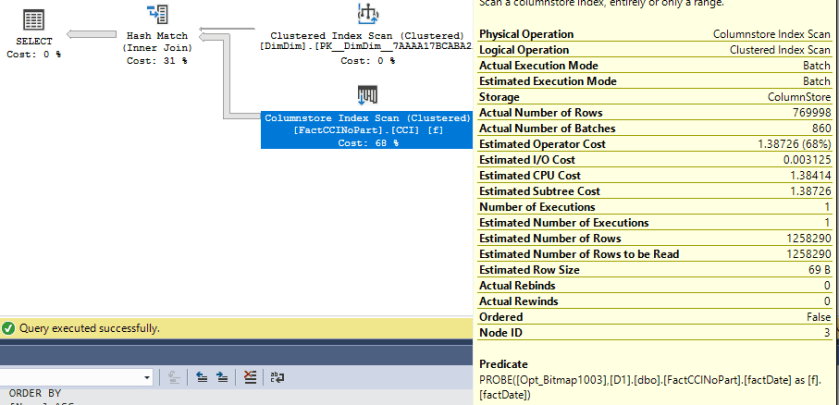
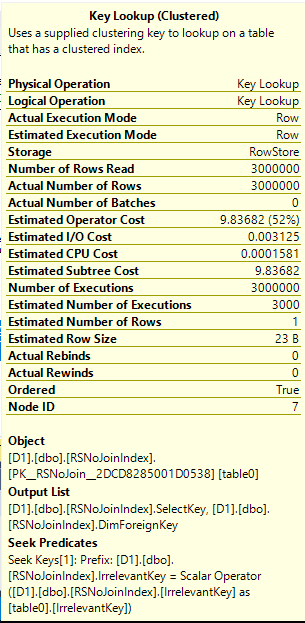
I get the properties that I’m after with a few undocumented tricks. The inflate grant column is a VARCHAR(8000) column. That data type significantly increases the memory grant for parallel inserts even with all NULLs. For the SLOW column, I’m loading integers evenly distributed between 0 and 7999. That data pattern can take longer than expected to compress. The worst case is with around 16000 distinct evenly distributed integers. If you’d like to understand why check out this answer by Paul White. Finally, the CROSS APPLY pattern means that I’ll get demand-based parallelism with each nested loop execution reading exactly enough rows from SLOW_TO_COMPRESS to fill up one rowgroup. It may be helpful to look at the query plan:

a38_query_plan

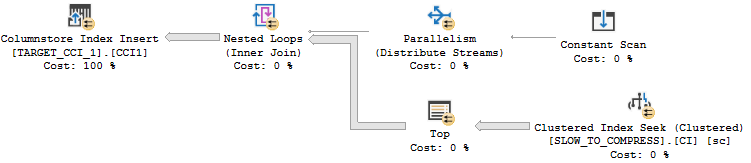
The query takes about 40 seconds to execute on my machine. If you’d like to follow along at home, set max server memory to 8000 MB and run the following code:

DROP TABLE IF EXISTS dbo.SLOW_TO_COMPRESS;

CREATE TABLE dbo.SLOW_TO_COMPRESS (
	FOR_SEEKING INT NULL,
	SLOW BIGINT NULL,
	INFLATE_GRANT VARCHAR(8000) NULL
);

CREATE CLUSTERED INDEX CI ON dbo.SLOW_TO_COMPRESS
(FOR_SEEKING);

INSERT INTO dbo.SLOW_TO_COMPRESS WITH (TABLOCK)
SELECT q.RN / 1048576, RN % 10000, NULL
FROM
(
	SELECT TOP (4 * 1048576) -1 + ROW_NUMBER()
		OVER (ORDER BY (SELECT NULL)) RN
	FROM master..spt_values t1
	CROSS JOIN master..spt_values t2
) q
OPTION (MAXDOP 1);

GO

DECLARE @table_id INT = 1,
@sql NVARCHAR(4000);

WHILE @table_id <= 6
BEGIN
	SET @sql = N'DROP TABLE IF EXISTS dbo.TARGET_CCI_'
	 + CAST(@table_id AS NVARCHAR(2))
	 + N'; CREATE TABLE dbo.TARGET_CCI_'
	 + CAST(@table_id AS NVARCHAR(2))
	 + N'(
		SLOW BIGINT NULL,
		INFLATE_GRANT VARCHAR(8000) NULL,
		INDEX CCI1 CLUSTERED COLUMNSTORE
	)';

	EXEC sp_executesql @sql;

	SET @table_id = @table_id + 1;
END;

GO

CREATE OR ALTER PROCEDURE dbo.INSERT_INTO_TARGET_CCI
(@table_id INT)
AS
BEGIN

DECLARE @sql NVARCHAR(4000) = N'INSERT INTO dbo.TARGET_CCI_'
+ CAST(@table_id AS NVARCHAR(2))
+ N' WITH (TABLOCK)
SELECT ca.SLOW, ca.INFLATE_GRANT
FROM (VALUES (0), (1), (2), (3)) v(x)
CROSS APPLY (
	SELECT TOP (1048576) sc.SLOW, sc.INFLATE_GRANT
	FROM SLOW_TO_COMPRESS sc
	WHERE sc.FOR_SEEKING = v.x
) ca
OPTION (MAXDOP 2)';

EXEC sp_executesql @sql;

END;

Error code 8645

Batch files that call sqlcmd are a convenient way to kick off lots of queries. For example:

START /B sqlcmd -d TEST -S .\SQL2017RTM -Q "EXEC dbo.INSERT_INTO_TARGET_CCI 1;" > nul
START /B sqlcmd -d TEST -S .\SQL2017RTM -Q "EXEC dbo.INSERT_INTO_TARGET_CCI 2;" > nul
START /B sqlcmd -d TEST -S .\SQL2017RTM -Q "EXEC dbo.INSERT_INTO_TARGET_CCI 3;" > nul
START /B sqlcmd -d TEST -S .\SQL2017RTM -Q "EXEC dbo.INSERT_INTO_TARGET_CCI 4;" > nul
START /B sqlcmd -d TEST -S .\SQL2017RTM -Q "EXEC dbo.INSERT_INTO_TARGET_CCI 5;" > nul

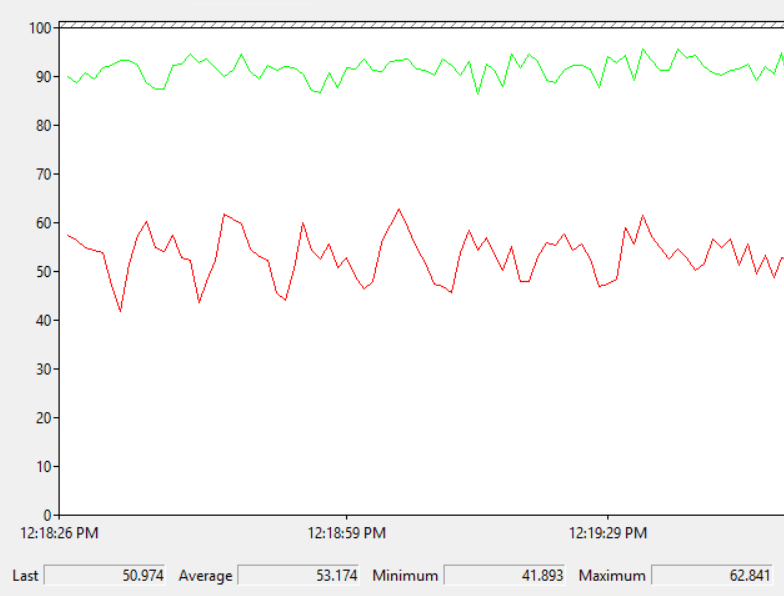
Note that I do not have Resource Governor enabled. If I kick off five queries at once using the batch file I don’t get an error. After 25 seconds two of the five queries are able to execute with the same memory grant as others:

a38_memory_grant_RTM

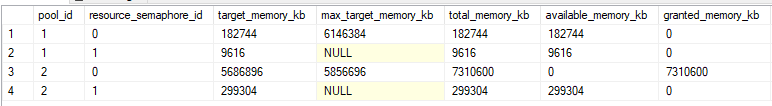
It does make me uncomfortable to see query memory grants exceed the target memory for the semaphore by so much, but at least it’s not over max server memory:

a38_semaphore_RTM

I ran the same test but kicked off a sixth query in SSMS. After 25 seconds I saw the following error for the sixth query:

Msg 8645, Level 17, State 1, Line 1
A timeout occurred while waiting for memory resources to execute the query in resource pool ‘default’ (2). Rerun the query.

I want my lawyer

On SQL Server 2017 CU14 I ran a variety of tests by changing the memory time-out settings at the Resource Governor query level or at the instance level. I tried different Resource Governor pools and even serial queries. I still saw a timeout of 25 seconds no matter what I did. I contacted the attorney that I keep on retainer to help me interpret SQL Server KB articles. Let’s review the relevant text again:

When you try to create a Columnstore Index on a table in Microsoft SQL Server 2016 or 2017, the request may fail after 25 seconds with memory time-out error 8645, depending on how many memory consuming queries are running concurrently and/or how much memory is available at the time of the request. The memory time-out error may occur even when you configure longer memory request time-out at an instance level or at a resource pool level.

He pointed out that the article doesn’t actually say that the time-out is now configurable. Just that it wasn’t configurable in the past. The symptom may strictly describe error 8645. So perhaps the adjustment was very narrow and has to do with avoiding that error only. Fair enough. I ran the same test that say error 8645 on RTM and the sixth query still hit error 8645.

Two of these things aren’t like the others

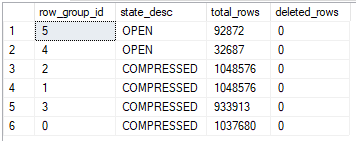
Let’s kick off five queries on CU14 and take another look at sys.dm_exec_query_memory_grants:

a38_memory_grant_new

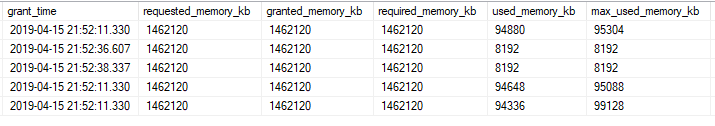
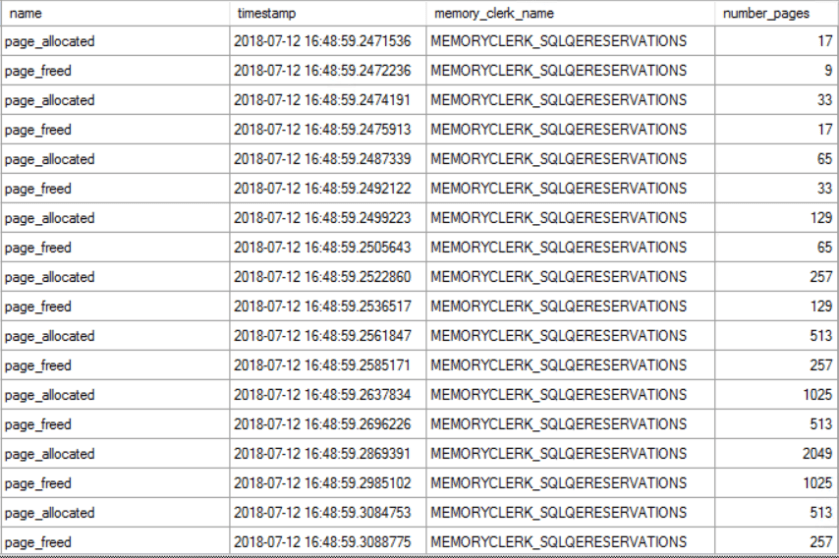
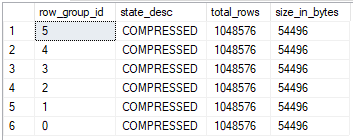
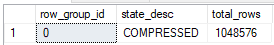
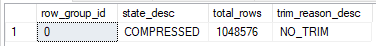
That’s odd. The two queries that hit the 25 second timeout have lower values for max_used_memory_kb than the queries that didn’t time out, even though the memory grants are the same. Looking at sys.dm_db_column_store_row_group_physical_stats for one of the tables with the lower memory grant:

a38_rowgroup_stats

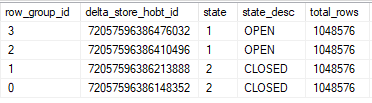
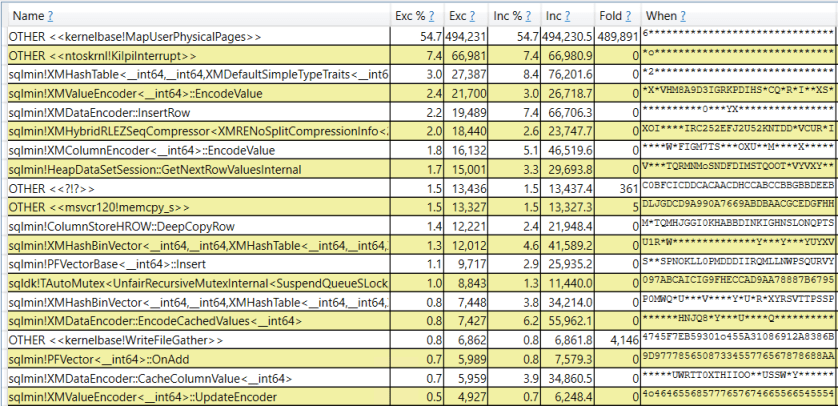
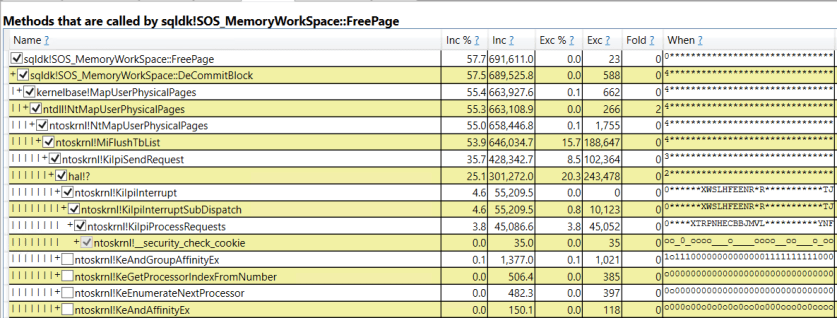
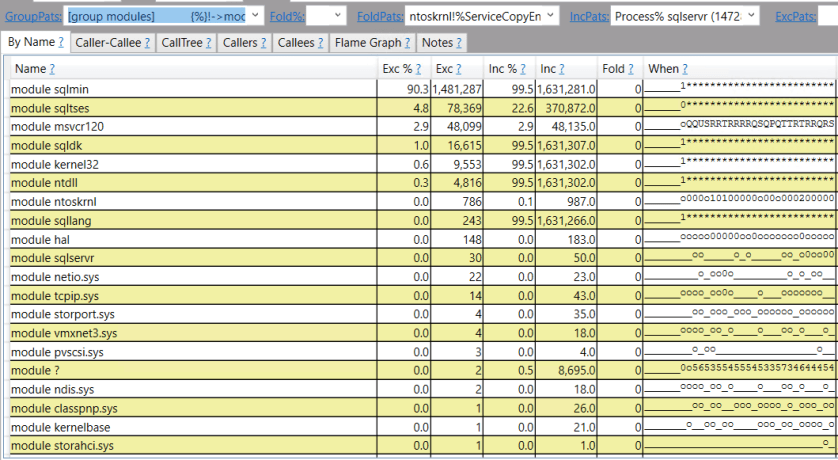
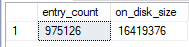
All rows were written to delta stores even though each thread got over 2 million rows. The query still takes its required memory grant but it doesn’t use most of the part reserved for columnstore compression. My best guess is that this is the change described in the KB article. A superficial glance suggests that the internal implementation is the same one used for writing to a delta store in serial:

a38_call_stacks

I think that I can understand the argument for making this change. However, I see intermittent intra-query parallel deadlocks when queries time out in this way:

Msg 1205, Level 13, State 78, Line 1
Transaction (Process ID 61) was deadlocked on lock | communication buffer resources with another process and has been chosen as the deadlock victim. Rerun the transaction.

I’ve also seen this error as well when going too far above target memory:

Msg 701, Level 17, State 123, Line 1
There is insufficient system memory in resource pool ‘default’ to run this query.

Personally, I’d like to see clearly defined behavior that focus on stability. When writing code that does parallel inserts into columnstore indexes it may be desirable to catch errors 8645, 1205, and 701 and to retry the insert after rolling back, perhaps at MAXDOP 1.

Final thoughts

Kb articles for SQL Server fixes can sometimes be misleading because they may focus on how the problem was described in a support ticket even if the scope of the fix or the solution have little to nothing to do with said description. After reading KB article 4480641 you could easily think that error code 8645 no longer occurs with parallel columnstore inserts or that it’s possible to override the 25 second memory timeout for columnstore inserts. Neither one of those is true. Parallel inserts into columnstore tables can still exceed target memory, but they write to multiple delta stores if they hit their 25 second timeout. Thanks for reading!

Advertisement

Extra Documentation for KB Article 4462481

SQL Server KB 4462481 is a bit light on details:

Assume that you use Microsoft SQL Server data warehousing. When you run parallel insert queries to insert data into a clustered columnstore index, the query operation freezes.

To quote one of the Top Men of SQL Server product support:

Hope this helps!

How to freeze your query

Consider a query execution that meets all of the following criteria:

  1. A parallel INSERT INTO… SELECT into a columnstore table is performed
  2. The SELECT part of the query contains a batch mode hash join
  3. The query can’t immediate get a memory grant, hits the 25 second memory grant timeout and executes with required memory

The query may appear to get stuck. It no longer uses CPU and the parallel worker threads appear to wait on each other. Let’s go through an example on SQL Server 2017 RTM. First create all of the following tables:

CREATE PARTITION FUNCTION PART_FUN_REP_SGM
(BIGINT)
AS RANGE LEFT
FOR VALUES (
  1, 2, 3
); 

CREATE PARTITION SCHEME PART_SCHEME_REP_SGM
AS PARTITION PART_FUN_REP_SGM
ALL TO ( [PRIMARY] );

DROP TABLE IF EXISTS dbo.SOURCE_DATA_FOR_CCI;

CREATE TABLE dbo.SOURCE_DATA_FOR_CCI (
	PART_KEY BIGINT NOT NULL,
	ID BIGINT NOT NULL,
	FAKE_COLUMN VARCHAR(4000) NULL
) ON PART_SCHEME_REP_SGM (PART_KEY);

INSERT INTO dbo.SOURCE_DATA_FOR_CCI WITH (TABLOCK)
SELECT TOP (1048576) 1, ROW_NUMBER()
	OVER (ORDER BY (SELECT NULL)) % 16000, NULL
FROM master..spt_values t1
CROSS JOIN master..spt_values t2
OPTION (MAXDOP 1);

INSERT INTO dbo.SOURCE_DATA_FOR_CCI WITH (TABLOCK)
SELECT TOP (1048576) 2, ROW_NUMBER()
	OVER (ORDER BY (SELECT NULL)) % 16000, NULL
FROM master..spt_values t1
CROSS JOIN master..spt_values t2
OPTION (MAXDOP 1);

DROP TABLE IF EXISTS dbo.LARGE_BATCH_MODE_MEMORY_REQUEST;

CREATE TABLE dbo.LARGE_BATCH_MODE_MEMORY_REQUEST (
	ID VARCHAR(4000),
	INDEX CCI CLUSTERED COLUMNSTORE
);

INSERT INTO dbo.LARGE_BATCH_MODE_MEMORY_REQUEST
	WITH (TABLOCK)
SELECT TOP (2 * 1048576) CAST(ROW_NUMBER()
	OVER (ORDER BY (SELECT NULL)) AS VARCHAR(8000))
	+ 'DYEL'
FROM master..spt_values t1
CROSS JOIN master..spt_values t2;

DROP TABLE IF EXISTS dbo.CCI_SLOW_TO_COMPRESS_TARGET_1;

CREATE TABLE dbo.CCI_SLOW_TO_COMPRESS_TARGET_1 (
	ID BIGINT NULL,
	INDEX CCI CLUSTERED COLUMNSTORE
);

DROP TABLE IF EXISTS dbo.CCI_SLOW_TO_COMPRESS_TARGET_2;

CREATE TABLE dbo.CCI_SLOW_TO_COMPRESS_TARGET_2 (
	ID BIGINT NULL,
	INDEX CCI CLUSTERED COLUMNSTORE
);

Consider the following query:

INSERT INTO dbo.CCI_SLOW_TO_COMPRESS_TARGET_1
	WITH (TABLOCK)
SELECT LEFT(t1.ID, 1)
FROM LARGE_BATCH_MODE_MEMORY_REQUEST t1
INNER JOIN LARGE_BATCH_MODE_MEMORY_REQUEST t2
	ON t1.ID = t2.ID

UNION ALL

SELECT ID
FROM dbo.SOURCE_DATA_FOR_CCI
OPTION (MAXDOP 2);

Here’s what the plan looks like:

a37_plan

I set Max Server Memory to 8000 MB and executed two queries with a maximum allowed memory grant of 60% via Resource Governor. The first query finished in about 40 seconds. The second query hasn’t finished after 30 minutes. During those 30 minutes the second query has only used 1184 ms of CPU time. The COLUMNSTORE_BUILD_THROTTLE wait type shows up in sys.dm_os_waiting_tasks:

a37_wait

Execution context id 2 is waiting on execution context id 1 with a wait type of HTDELETE. Execution context id 1 has a wait type of COLUMNSTORE_BUILD_THROTTLE. I don’t think that this wait is supposed to show up for parallel inserts. It can show up by design when creating or rebuilding a columnstore index in parallel:

When a columnstore index is being built, the memory grant estimate is based on a segment size of one million rows. The first segment of the index is built using a single thread so the real, required per-thread memory grant is found. Then the memory grants are given per thread and the other segments are built multi-threaded. Although all the threads for the operation are allocated at the start of the build, only one thread is used for the first segment and all the others incur a COLUMNSTORE_BUILD_THROTTLE wait.

The important point is that a wait type of COLUMNSTORE_BUILD_THROTTLE means that worker thread is waiting on another thread to do something. But so does a wait time of HTDELETE. There are only two worker threads and both of them are waiting on another thread to do something. As a result, the query makes no progress. I’ve let similar queries run for 72 hours before giving up and killing them.

How to unfreeze your query

Upgrading to SQL Server 2017 CU11 or higher fixes the issue. With that said, if you’re seeing this issue that means that you have columnstore insert queries waiting at least 25 seconds for a memory grant. That should be considered to be a problem even if the queries didn’t get stuck. If you find yourself in this situation, I strongly consider increasing memory available to SQL Server or limiting memory grants via Resource Governor or some other method.

Final Thoughts

If you have parallel insert queries into CCis that appear to be stuck with no CPU usage and long COLUMNSTORE_BUILD_THROTTLE wait times check your version of SQL Server. Upgrading to at least CU11 will resolve the immediate issue, but consider a more complete fix will include addressing the RESOURCE_SEMAPHORE waits that must be present on your system. Thanks for reading!

What To Do When Wait Stats Don’t Help

Some SQL Server workloads are slow even though there aren’t any hints in the wait stats that suggest ways to make them go faster. This blog post works through a columnstore example of such a workload.

The Test Setup

The test server has 96 physical cores. The test workload has many concurrent writers to the same columnstore target table. The source data is a simple staging table with ten columns. Each column contains sequential integers from 1 to 10485760. Here is T-SQL to create and populate the tables:

DROP TABLE IF EXISTS dbo.RS_SOURCE_10_COLUMN_SIMPLE;

CREATE TABLE dbo.RS_SOURCE_10_COLUMN_SIMPLE (
    ID1 BIGINT,
    ID2 BIGINT,
    ID3 BIGINT,
    ID4 BIGINT,
    ID5 BIGINT,
    ID6 BIGINT,
    ID7 BIGINT,
    ID8 BIGINT,
    ID9 BIGINT,
    ID10 BIGINT
);

INSERT INTO dbo.RS_SOURCE_10_COLUMN_SIMPLE
	WITH (TABLOCK)
SELECT q.ID, q.ID, q.ID, q.ID, q.ID
, q.ID, q.ID, q.ID, q.ID, q.ID
FROM
(
       SELECT TOP (10485760) ROW_NUMBER()
             OVER (ORDER BY (SELECT NULL)) ID
       FROM master..spt_values t1
       CROSS JOIN master..spt_values t2
       CROSS JOIN master..spt_values t3
) q
OPTION (MAXDOP 1);

DROP TABLE IF EXISTS dbo.CCI_TARGET_10_COLUMN;

CREATE TABLE dbo.CCI_TARGET_10_COLUMN (
    ID1 BIGINT,
    ID2 BIGINT,
    ID3 BIGINT,
    ID4 BIGINT,
    ID5 BIGINT,
    ID6 BIGINT,
    ID7 BIGINT,
    ID8 BIGINT,
    ID9 BIGINT,
    ID10 BIGINT,
    INDEX CCI0 CLUSTERED COLUMNSTORE
);

Concurrency is controlled by changing the number of stored procedures kicked off by a SQLCMD batch file. Each stored procedure does a single MAXDOP 1 insert from the staging table into the columnstore table. This test is different from the previous columnstore insert test documented here in that all of the sessions write to the same table and the source data gets significantly worse compression. In addition, each stored procedure only does a single insert, so the total overall work done increases as the number of concurrent sessions increases. If I run a single insert like the following:

INSERT INTO dbo.CCI_TARGET_10_COLUMN
SELECT *
FROM dbo.RS_SOURCE_10_COLUMN_SIMPLE
OPTION (MAXDOP 1);

That takes about 25 seconds to complete on the test server. It would be ideal if the average run time of the stored procedure stays at around 25 seconds as concurrency increases.

Test Results

We are not in an ideal world. The average run time of each stored procedure execution quickly increases with the number of concurrent sessions:

a34_scale_table

It may be slightly unreasonable to expect 96 concurrent sessions to scale perfectly well and to end up with an average run time of 24 seconds. With that said, the observed overhead is almost 4X at that scale. Let’s start by looking at wait stats:

a34_waits_for_LPIM_96

Most of the entries are related to memory. SOS_PHYS_PAGE_CACHE shows up because LPIM is enabled. This might be a helpful clue, but the waits only add up to about 10 seconds of waits per second. On a server with 96 cores that alone cannot explain a 4X degradation in scalability.

There is nothing helpful in latches:

a34_latches_for_LPIM_96

A number of spinlock collisions occurred during the workload:

a34_spins_for_LPIM_96

This is entirely a judgment call on my part, but based on my experience on this server and with similar workloads I don’t find those spinlock numbers to be at all remarkable. With that said, one avenue of investigation would be to dig into those spinlocks more.

From my point of view, the most important clue is that the server experiences high CPU throughout the workload according to SQL Server (using sys.dm_resource_governor_resource_pools), resource monitor, and perfmon. Perfmon also reports high privileged time:

a34_perfmon

SQL Server appears to be doing something which requires significantly more CPU at higher concurrency. Therefore, it makes perfect sense that the wait stats and latch stats alone aren’t very helpful. It’s reasonable to expect most wait types and latch classes to result in low CPU during their waits as opposed to high CPU.

ETW Tracing

ETW tracing can be used to diagnose CPU issues on servers. I’m still pretty new at it, but I use PerfView. In particular, what I really want to see is sampled call stacks to get an idea as to where CPU is being spent. I took a ten second sample during the 96 concurrent session workload and grouped by module name:

a34_perfview_LPIM_modules

The circled modules are typically what I see in SQL Server call stacks. SQL Server is responsible for the majority of CPU work on the server, but the majority of the work is done in the ntoskrnl and hal modules. I have it on good authority that CPU spent in that context will be tracked as privileged time in perfmon, so this roughly lines up with the perfmon graph previously shown.

A different view of the data reveals that most of the work is done as part of kernalbase!MapuserPhysicalPages:

a34_perfview_LPIM_just_my_app

In addition, we can see methods that call kernalbase!MapuserPhysicalPages:

a34_perfview_LPIM_methods_call_mapPhysicalPages

Presenting the data in a different way, we can see what was called by sqldk!SOS_MemoryWorkSpace::FreePage:

a34_perfview_LPIM_callee_free_Page

It appears that most of the CPU during the workload is spent returning memory from SQL Server to the OS. Backing that up, the memory commit for SQL Server was observed to decrease during the workload through resource monitor, even though there wasn’t any pressure from the OS and the total commit size was only at about 50% of max server memory.

For this workload, we are lucky in that important call stack names can be tied back to something in SQL Server. For example, sqldk!SOS_MemoryWorkSpace::FreePage would appear to be associated with freeing pages and that can be tracked from within SQL Server using extended events.

Extending The Investigation

The page_allocated and page_freed debug extended events are helpful in understanding how memory is allocated and freed during a query’s execution. First I started with a histogram target on memory_clerk_name for the page_freed event page_freed filtered to a single session. Here’s what that looks like:

a34_histogram

Nearly all of the free page events are for the MEMORYCLERK_SQLQERESERVATIONS clerk. I believe this clerk is responsible for granted query memory so this makes sense. Next we can turn on causality tracking and include the page_allocated event as well. Here’s a screenshot of some of the data for a simple CCI insert that processes three rowgroups in total:

a34_XE_picture

There are many different patterns in the data. Sometimes there is a series of free events and sometimes there is a series of allocation events. They can also alternate as shown in the picture above. The number of pages freed or allocated is usually one plus a power of two. I saved the data to a table and calculated a running total of current memory allocations for the query. The running total increased whenever pages were allocated and decreased whenever pages were freed. I’m really phoning it in with this graph, but here are the results:

a34_running_total_graph

The x-axis is time and the y-axis is total pages currently allocated to the query. This query compresses three rowgroups in total. That’s why the pattern repeats three times. Other than that, the only thing I was able to tie back to the compression algorithm was that pages are rapidly freed as segments are finished:

a34_segment_deallocations

In summary, page allocations and page free events rapidly occur, sometimes in an alternating pattern. SQL Server will often free a number of pages just to immediately request allocations for a similar number of pages. If all of the free page events result in returned memory to the OS then the reason for the scalability bottleneck becomes clear. When running the full workaround with 96 concurrent sessions, a total of 341965 page freed operations were performed. Those events freed about 71.3 million pages in total. That amounts to about 584 GB of memory returned to the OS in total, based on the previous assumptions.

It seemed bizarre to me for SQL Server to return so much memory to the OS during columnstore compression even though it would very likely immediately need more memory for compression. A colleague suggested that this could be a deliberate design decision by Microsoft to reduce the likelihood of out-of-memory errors when allocating memory above the max server memory setting:

“Starting with SQL Server 2012 (11.x), SQL Server might allocate more memory than the value specified in the max server memory setting. This behavior may occur when the Total Server Memory (KB) value has already reached the Target Server Memory (KB) setting (as specified by max server memory). If there is insufficient contiguous free memory to meet the demand of multi-page memory requests (more than 8 KB) because of memory fragmentation, SQL Server can perform over-commitment instead of rejecting the memory request.

This behavior is typically observed during the following operations:

Large Columnstore index queries.
Columnstore index (re)builds, which use large volumes of memory to perform Hash and Sort operations.”

What is Normal?

All of the above observations around memory allocations and freed memory are interesting but some additional context is needed. I suspect that it doesn’t, but it’s possible that a traditional row mode query would show the same pattern of allocated and freed pages. To investigate that, I created a row mode query with a memory consuming operator that processes a result set of rows, releases the rows, and continues to do so in a loop. The query plan looks like this:

a34_query_plan

Note the Hash Match (Aggregate) operator on the inner side of the nested loop. For each row in the DRIVE_ME table, SQL Server will send nearly all of the rows from DISTINCT_ONE_COL into the hash match operator. The reason that I went for this type of query is that it felt like the most similar pattern to columnstore compression in that compression processes up to 1048576 rows per thread in what’s effectively a loop. For those following along at home here is T-SQL to generate that query plan:

drop table if exists DRIVE_ME;

create table DRIVE_ME (ID INT);

INSERT INTO DRIVE_ME VALUES
(1), (2), (3), (4), (5), (6), (7),
(8), (9), (10), (11), (12), (13), (14);

drop table if exists DISTINCT_ONE_COL;

create table DISTINCT_ONE_COL (ID INT);

INSERT INTO DISTINCT_ONE_COL WITH (TABLOCK)
SELECT TOP (10000000) ROW_NUMBER()
      OVER (ORDER BY (SELECT NULL)) ID
FROM master..spt_values t1
CROSS JOIN master..spt_values t2
CROSS JOIN master..spt_values t3
OPTION (MAXDOP 1)

GO

CREATE OR ALTER PROCEDURE
dbo.REPEATED_ROW_MODE_ALLOC AS
BEGIN
SET NOCOUNT ON;
SELECT ca.cnt
FROM DRIVE_ME d
OUTER APPLY
(
	SELECT COUNT(DISTINCT ID)
	FROM DISTINCT_ONE_COL
	WHERE ID > d.ID
) ca (cnt)
OPTION (MIN_GRANT_PERCENT = 2.5)
END;

On the test server executing a single query took around 90 seconds. That single query execution frees around 760000 memory pages in total. Memory is allocated and freed in cycles. There isn’t a pattern where allocation and free events trade off between each other.

The workload does very well at scale. With 96 concurrent sessions the average stored procedure execution remains at around 90 seconds. We’re freeing the same amount of pages in total as the columnstore insert workload without seeing a drop in scalability. We can again use PerfView to analyze the workload by modules:

a34_perfview_rowstore_modules

This time most of the CPU is spent on SQL Server managed code. Drilling down, the operation that uses the most CPU appears to involving inserting rows into a hash table that’s in a query’s memory grant:

a34_perfview_rowstore_biggest_cpu

There isn’t necessarily anything wrong with this. After all, something needs to use the most CPU during the workload and we do achieve very good scalability. To me, the most important part is how call stacks are different when looking at everything called by sqldk!SOS_MemoryWorkSpace::FreePage:

a34_perfview_rowstore_callee_free_Page

Within SQLOS we call “FreeBlock” instead of “DecommitBlock”. The windows OS calls are significantly different compared to columnstore compression and I wasn’t able to observe the memory commit for SQL Server changing during the workload. I can’t say for sure, but it looks like when memory is freed for memory-consuming row mode operators it is returned to SQL Server as opposed to returned to the OS. That makes a big difference in scalability.

I wanted to test with batch mode memory consuming operators, but couldn’t figure out a query pattern that resulted in the number of processed rows getting constantly reset for an operator that didn’t involve UDFs. I will say that I observed memory getting returned to the OS during batch mode queries, but I did not immediately see the performance bottleneck around freeing the pages. It’s possible that with more work a demo could be created to show this bottleneck. It’s also possible that the different pattern of freed pages means that it won’t realistically happen. In my limited testing I did not see batch mode operators free pages before they had done all of their work, which is significantly different from the columnstore compression pattern of allocating and freeing pages.

Changing the Memory Model

We know that the problem has to do with memory deallocation, so testing with the conventional and large pages memory models may be fruitful. The workload significantly degraded without lock pages in memory. The average insert time was about 368 seconds with 96 concurrent sessions. 91% of the workload time can be tied back to memory related waits:

a34_convential_waits

At first glance, this workload has a problem with memory allocation as opposed to freeing memory pages. It would be possible to use techniques within SQL Server to further drill into the scalability bottleneck, but I will not do that analysis here.

Enabling large pages for the buffer pool via TF 834 does not resolve this bottleneck. The average insert completion time is nearly identical to the LPIM test and I did not observe any significant differences in PerfView results. TF 834 is helpful with some columnstore workloads but it does not help with this one. Keep in mind that TF 834 is not supported with columnstore according to Microsoft.

Waiting for a Wait Type

I’m not a cloud guy, but I wonder if it would even be possible to troubleshoot an issue like this if the investigator doesn’t have access to the underlying OS or the ability to install ETW tracing tools. It would be helpful if Microsoft was able to capture and present this bottleneck in SQL Server. For example, a new wait type could be defined named something like “RESERVED_MEMORY_FREE_EXT” with the timer starting after sqldk!SOS_MemoryWorkSpace::DeCommitBlock and ending after the OS owned code finishes its work. A defined wait type would make it much more obvious that there’s a problem and allow affected end users to easily search for guidance or workarounds for the issue. This would be a cpu busy external wait. I don’t know if defining a wait like this is in line with Microsoft’s general philosophy for designing wait types, but it’s just an idea.

If the bottleneck in the OS truly can’t be solved then perhaps it could be protected by a spinlock within SQL Server. That spinlock might not accomplish anything other than letting someone who only has access to SQL Server know that there’s a problem. Again I don’t know if that’s an appropriate use of a spinlock. I’m out of my depth here when it comes to suggestions like these, but I do think there is a need to classify this bottleneck. Of course, Microsoft making code changes in SQL Server or even in Windows Server to resolve the bottleneck would be preferred.

Final Thoughts

This blog post covered the investigation of a slow workload for which wait stats were not helpful in diagnosing the problem. In summary:

  1. ETW tracing and extended events revealed a bottleneck related to returning memory to the OS from SQL Server. This bottleneck can occur when loading data into columnstore tables at reasonably high concurrency.
  2. Lock pages in memory can have a dramatic effect on workload performance even when paging to disk is not occurring. This must be a gross oversimplification, but with LPIM SQL Server uses different OS calls to manage memory and the difference in those calls can lead to scalability issues with and without LPIM. For example, highly concurrent workloads that call HASHBYTES have been observed to get better throughput with LPIM.
  3. For columnstore workloads on SQL Server 2017, I recommend the use of LPIM unless there is a very good reason not to use it. I have seen LPIM cause performance issues on SQL Server 2016 but have not fully sourced those issues. LPIM still may be the right starting point on SQL Server 2016.
  4. The investigation did not have a happy ending in that it isn’t clear how to resolve the bottleneck except by lowering concurrency. However, the work done here does provide a helpful foundation for reaching out to a VM or Windows admin or for opening a support ticket with Microsoft.

Thanks for reading!

Can Rowstore Compression Beat Columnstore Compression?

Columnstore has quite a few different tricks for compressing data. This blog post explores if it’s possible for a rowstore table to beat columnstore compression, even in the best case scenario for the columnstore table (no delta stores and rowgropus of the maximum size).

Page Compression and String Data

Everybody knows that strings aren’t the best fit for columnstore tables. Let’s start by puting sequential integers from 1 to 1048576 into a page compressed table:

DROP TABLE IF EXISTS dbo.RS_VARCHAR33;
GO
CREATE TABLE dbo.RS_VARCHAR33 (
	ID1 VARCHAR(33)
) WITH (DATA_COMPRESSION = PAGE);

INSERT INTO dbo.RS_VARCHAR33 WITH (TABLOCK)
SELECT TOP (1048576) ROW_NUMBER()
	OVER (ORDER BY (SELECT NULL)) ID
FROM master..spt_values t1
CROSS JOIN master..spt_values t2
OPTION (MAXDOP 1);

According to sp_spaceused, the table takes up 11464 KB of space. Next load the same data into a columnstore table:

DROP TABLE IF EXISTS dbo.CCI_VARCHAR33;
GO
CREATE TABLE dbo.CCI_VARCHAR33 (
	ID1 VARCHAR(33),
	INDEX C CLUSTERED COLUMNSTORE
);

INSERT INTO dbo.CCI_VARCHAR33 WITH (TABLOCK)
SELECT TOP (1048576) ROW_NUMBER()
	OVER (ORDER BY (SELECT NULL)) ID
FROM master..spt_values t1
CROSS JOIN master..spt_values t2
OPTION (MAXDOP 1);

The CCI takes up 14408 KB of space. The majority of the space is used for the dictionary. The follow query returns 11495348 bytes:

SELECT csd.on_disk_size
FROM sys.column_store_dictionaries csd
INNER JOIN sys.partitions sp
	ON csd.partition_id = sp.partition_id
WHERE sp.[object_id] = OBJECT_ID('CCI_VARCHAR33');

Data types matter here. If I change the CCI to have a VARCHAR(32) column instead then the table only requires 1800 KB of space. A dictionary is not created in this case. A takeaway is that SQL Server may choose to create a dictionary based on the length of the defined string column. Data sets with many unique strings may require a relatively large amount of space for the dictionary, even to the point where page compressed data can have overall a lower footprint on the database.

Page Compression and Non-string Data

It’s certainly more difficult to come up with a demo that works without string columns, but consider how the page compression algorithm works. Data can be compressed on page basis, which includes both multiple rows and multiple columns. That means that page compression can achieve a higher compression ratio when a row has identical values in different columns. Columnstore is only able to compress on an individual column basis and you won’t directly see better compression with repeated values in different columns for a single row (as far as I know).

The table defined and populated below requires 11912 KB of disk space:

DROP TABLE IF EXISTS dbo.RS_4_COLUMN;
GO
CREATE TABLE dbo.RS_4_COLUMN (
	ID1 BIGINT,
	ID2 BIGINT,
	ID3 BIGINT,
	ID4 BIGINT
) WITH (DATA_COMPRESSION = PAGE);

INSERT INTO dbo.RS_4_COLUMN WITH (TABLOCK)
SELECT ID, ID, ID, ID
FROM (
	SELECT TOP (1048576) ROW_NUMBER()
		OVER (ORDER BY (SELECT NULL)) / 10 ID
	FROM master..spt_values t1
	CROSS JOIN master..spt_values t2
) q
OPTION (MAXDOP 1);

If I rerun the code with five columns, the table now takes up 13000 KB of space. That’s only an increase of 9% in space to hold 25% more data. The same data loaded into a columnstore table with four columns takes 11272 KB of space. Adding one column results in a total size of 14088 KB, which is almost exactly a 25% increase. For this data set with five columns, page compression across rows is more efficient than standard columnstore compression.

Row Compression and Non-string Data

Row compression doesn’t allow for compression benefits from storing the same value in multiple columns. Is it possible to beat columnstore compression with row compression without string columns? You betcha!

DROP TABLE IF EXISTS #BATCH_MODE;
CREATE TABLE #BATCH_MODE (
	ID INT,
	INDEX C CLUSTERED COLUMNSTORE
);

DROP TABLE IF EXISTS dbo.RS_2_COLUMN_ROW_COMPRESSED;
GO
CREATE TABLE dbo.RS_2_COLUMN_ROW_COMPRESSED (
	ID1 BIGINT,
	ID2 BIGINT
) WITH (DATA_COMPRESSION = ROW);

INSERT INTO dbo.RS_2_COLUMN_ROW_COMPRESSED WITH (TABLOCK)
SELECT
  SUM(q.ID) OVER (ORDER BY q.ID)
, SUM(q.ID) OVER (ORDER BY q.ID)
FROM
(
	SELECT TOP (1048576) ROW_NUMBER()
		OVER (ORDER BY (SELECT NULL)) ID
	FROM master..spt_values t1
	CROSS JOIN master..spt_values t2
) q
LEFT OUTER JOIN #BATCH_MODE ON 1 = 0
OPTION (MAXDOP 1);

EXEC sp_spaceused 'RS_2_COLUMN_ROW_COMPRESSED';

DROP TABLE IF EXISTS #BATCH_MODE;
CREATE TABLE #BATCH_MODE (
	ID INT,
	INDEX C CLUSTERED COLUMNSTORE
);

DROP TABLE IF EXISTS dbo.CCI_2_COLUMN;
GO
CREATE TABLE dbo.CCI_2_COLUMN (
	ID1 BIGINT,
	ID2 BIGINT,
	INDEX C CLUSTERED COLUMNSTORE
);

INSERT INTO dbo.CCI_2_COLUMN WITH (TABLOCK)
SELECT
  SUM(q.ID) OVER (ORDER BY q.ID)
, SUM(q.ID) OVER (ORDER BY q.ID)
FROM
(
	SELECT TOP (1048576) ROW_NUMBER()
		OVER (ORDER BY (SELECT NULL)) ID
	FROM master..spt_values t1
	CROSS JOIN master..spt_values t2
) q
LEFT OUTER JOIN #BATCH_MODE ON 1 = 0
OPTION (MAXDOP 1);

EXEC sp_spaceused 'CCI_2_COLUMN';

In this example, the rowstore table has a total size of 15496 KB but the columnstore has a total size of 16840 KB. I’m honestly not sure why this happens. I did try to pick the unfriendliest data set to columnstore compression that I could: no repeated values and no obvious patterns in data. Perhaps there’s some additional overhead of compression that pushes it over the row compressed data.

Final Thoughts

Columnstore doesn’t guarantee better compression than rowstore, even with perfectly sized rowgroups. Rowstore can provide better compression ratios for string columns, tables with repeated values across columns, and in other uncommon scenarios. A summary of test results is here:

a33_summary

The differences are small per rowgroup, but they can add up as more columns and more rows are added to the tables. I’ve seen tables in the real world that ended up bigger as columnstore compared to rowstore, which is what inspired me to look for some of these examples. Thanks for reading!

The Return of RESERVED_MEMORY_ALLOCATION_EXT

It is possible to see a scalability bottleneck in the form of high average wait time for the RESERVED_MEMORY_ALLOCATION_EXT wait if a highly concurrent workload is run on a server that consumes memory with batch mode operators. I believe that the severity of the bottleneck depends on unknown factors in the server’s initial memory state and the rate of memory actually used by queries to run batch mode operations. This blog post shares a reproduction of the issue along with a call to action.

The Test Query

Data prep for the test query is very simple. We throw the first ten million sequential integers into two single column BIGINT tables. Additionally, an empty CCI is created to add eligibility for batch mode as desired:

DROP TABLE IF EXISTS DUMMY_CCI;
CREATE TABLE DUMMY_CCI (
	ID INT,
	INDEX CCI CLUSTERED COLUMNSTORE
);

DROP TABLE IF EXISTS HASH_JOIN_SCALE_TEST_1;
CREATE TABLE HASH_JOIN_SCALE_TEST_1 (
	ID BIGINT NOT NULL
);

INSERT INTO HASH_JOIN_SCALE_TEST_1 WITH (TABLOCK)
SELECT TOP (10000000) ROW_NUMBER()
	OVER (ORDER BY (SELECT NULL))
FROM master..spt_values t1
CROSS JOIN master..spt_values t2
CROSS JOIN master..spt_values t3
OPTION (MAXDOP 1);

DROP TABLE IF EXISTS HASH_JOIN_SCALE_TEST_2;
CREATE TABLE HASH_JOIN_SCALE_TEST_2 (
ID BIGINT NOT NULL
);

INSERT INTO HASH_JOIN_SCALE_TEST_2 WITH (TABLOCK)
SELECT TOP (10000000) ROW_NUMBER()
	OVER (ORDER BY (SELECT NULL))
FROM master..spt_values t1
CROSS JOIN master..spt_values t2
CROSS JOIN master..spt_values t3
OPTION (MAXDOP 1);

The SELECT query that we’re going to test with joins them together and returns a count of distinct IDs:

SELECT COUNT(DISTINCT t1.ID)
FROM dbo.HASH_JOIN_SCALE_TEST_1 t1
LEFT OUTER JOIN dbo.HASH_JOIN_SCALE_TEST_2 t2
	ON t1.ID = t2.ID
OPTION (MAXDOP 1);

This is certainly an odd thing to do, but the point of this query is to create a simple test case that uses a bit of memory to create hash tables. Without any indexes on the table we’re very likely to get a hash join. In row mode the query takes about 17 seconds on the test server and uses 1257528 KB of memory.

As far as I can tell this query is a good fit for batch mode. The join is on BIGINT columns and everything except for the rowstore scans can execute in batch mode:

a28_query_plan

Even with the hidden conversions of 20 million rows from row mode to batch mode the query finishes in about 5 seconds. It uses significantly less memory compared to the row mode query: 386112 KB. All of this seems very reasonable.

Testing at Scale

The situation becomes less reasonable once there are many concurrent queries running at once. We go from the batch mode query running in a third of the time of row mode to sometimes running slower. Testing was done with 96 concurrent queries each running queries until 576 total queries were completed. Below is a graph of OS CPU and OS privileged time CPU based on perfmon data:

a28_cpu_graphs

The first third of the graph corresponds to the batch mode workload. CPU never hits 100% and is extremely variable during the run. We also see a high amount of privileged time in the OS. Within SQL Server, we use a total of 222,400,512 KB of query memory. The total wait time for RESERVED_MEMORY_ALLOCATION_EXT can vary, but for this one it was around 11.5 million ms.

The second third of the graph is the part that resets the server memory state. As stated in the introduction, this scalability bottleneck doesn’t always happen and seems to have some kind of dependency on the server’s initial memory state. Here we do a SELECT COUNT(*) on a 1 TB table to add pressure to the rowstore buffer pool.

The final third of the graph corresponds to the row mode workload. CPU jumps to near 100% very quickly and doesn’t waver much during the run. There is very little privileged time in the OS. Within SQL Server, we use a total of 724,336,128 KB of query memory. The wait time for RESERVED_MEMORY_ALLOCATION_EXT is always significantly reduced compared to batch mode. For this run it was around 107k ms.

In conclusion, we see about 1% of memory wait time with the row mode workload compared to the batch mode workload. Usually the row mode workload finishes a little faster than the batch mode one, despite needing over 3X as much total memory and the per-query efficiency advantage of batch mode.

Speculation on the Problem

There may be a hint in the memory management architecture guide:

Starting with SQL Server 2012, SQL Server might allocate more memory than the value specified in the max server memory setting. This behavior may occur when the Total Server Memory (KB) value has already reached the Target Server Memory (KB) setting (as specified by max server memory). If there is insufficient contiguous free memory to meet the demand of multi-page memory requests (more than 8 KB) because of memory fragmentation, SQL Server can perform over-commitment instead of rejecting the memory request.

This behavior is typically observed during the following operations: Large Columnstore index queries.

There are observable differences in how memory is allocated for the same operator when switching from batch mode to row mode. The number of wait events for RESERVED_MEMORY_ALLOCATION_EXT is significantly higher for row mode compared to batch mode. In addition, it remains nearly constant when TF 834 is enabled:

a28_memory_waits

TF 834 appears to fully resolve the scalability issue with batch mode, just like last time. It offers a dramatic improvement in workload completion time:

a28_summary_of_timings

Perhaps some batch mode operators require contiguous free memory for their allocations but the same operation done through row mode does not have that restriction. I can’t go any further than this because I don’t know anything about OS internals or memory management, but it could explain why we see such different behavior between row mode and batch mode.

Use Your Voice

Since SQL Server 2012, Microsoft has listed TF 834 as incompatible with columnstore. There are lots of scary consequences:

  • A non-yielding scheduler error and associated memory dumps in the SQL Server Error log.
  • Columnstore queries trigger severe performance issues.
  • A SQL Server instance triggers access violations when you execute Columnstore queries.
  • You encounter the following error when you run sp_createstats

However, I’ve been told that many of the SQL Server columnstore benchmarks for the TPC-H benchmarks use TF 834. It seems to be a natural fit for columnstore, and there are some workloads (seen in the lab and reproduced in the last two blog posts) where it resolves a key scalability bottleneck which is difficult to address through other means. I have created a feedback item on UserVoice requesting that Microsoft support TF 834 with columnstore.

Final Thoughts

Please provide feedback on the UserVoice item if you are able to do so. Thanks for reading!

Large CCI ETLs Cannot Scale Without TF 834

Large servers may experience a scalability bottleneck related to the RESERVED_MEMORY_ALLOCATION_EXT wait event during loading of columnstore tables. This blog post shares a reproduction of the issue and discusses some test results.

The Test Server

Testing was done on a four socket bare metal server with 24 cores per socket. The server had 1 TB of RAM and storage was provided by a SAN. Within SQL Server, we were able to read data at a peak rate of about 5.5 GB/s. Hyperthreading was disabled, but there aren’t any other nonstandard OS configuration settings that I’m aware of.

SQL Server 2016 SP1 CU7 was installed on Windows Server 2016. Most default settings were retained for this testing, including allowing auto soft-NUMA to break up the 96 schedulers into 12 groups of 8, with 3 per memory node. Max server memory was set to around 800000 MB. The user database had 24 data files, indirect checkpoints weren’t used, and the memory model in use was conventional. No interesting trace flags were enabled, except perhaps for TF 4199. I did grow max server memory to close to the maximum before starting any of the tests.

Testing Code and Method

The workload test loaded the same data from a SQL Server table into 576 CCI target tables. For my testing I used a source table of one million rows. Each session grabs a number from a sequence, loads data into the table corresponding to the sequence number, and continues to do that until there are no more tables to process. This may seem like an odd test to run, but think of it as an abstract representation of a columnstore ETL workload which loads data into partitioned CCIs.

The first step is to define the source table. I created a 50 column table that stored only 0s in all of its rows. There’s nothing particularly special about this choice other that it has a very low disk footprint as a CCI because it compresses so well. On a non-busy system it took around 7.3 seconds to insert one million rows into a CCI. Below is the table definition:

DROP TABLE IF EXISTS CCI_SOURCE;

CREATE TABLE CCI_SOURCE (
ID1 SMALLINT,
ID2 SMALLINT,
ID3 SMALLINT,
ID4 SMALLINT,
ID5 SMALLINT,
ID6 SMALLINT,
ID7 SMALLINT,
ID8 SMALLINT,
ID9 SMALLINT,
ID10 SMALLINT,
ID11 SMALLINT,
ID12 SMALLINT,
ID13 SMALLINT,
ID14 SMALLINT,
ID15 SMALLINT,
ID16 SMALLINT,
ID17 SMALLINT,
ID18 SMALLINT,
ID19 SMALLINT,
ID20 SMALLINT,
ID21 SMALLINT,
ID22 SMALLINT,
ID23 SMALLINT,
ID24 SMALLINT,
ID25 SMALLINT,
ID26 SMALLINT,
ID27 SMALLINT,
ID28 SMALLINT,
ID29 SMALLINT,
ID30 SMALLINT,
ID31 SMALLINT,
ID32 SMALLINT,
ID33 SMALLINT,
ID34 SMALLINT,
ID35 SMALLINT,
ID36 SMALLINT,
ID37 SMALLINT,
ID38 SMALLINT,
ID39 SMALLINT,
ID40 SMALLINT,
ID41 SMALLINT,
ID42 SMALLINT,
ID43 SMALLINT,
ID44 SMALLINT,
ID45 SMALLINT,
ID46 SMALLINT,
ID47 SMALLINT,
ID48 SMALLINT,
ID49 SMALLINT,
ID50 SMALLINT
);

INSERT INTO CCI_SOURCE WITH (TABLOCK)
SELECT
 ID,ID,ID,ID,ID,ID,ID,ID,ID,ID
,ID,ID,ID,ID,ID,ID,ID,ID,ID,ID
FROM (
	SELECT TOP (1000000) 0 ID
	FROM master..spt_values t1
	CROSS JOIN master..spt_values t2
) t;

Next we need a stored procedure that can save off previous test results (as desired) and reset the server for the next test. If a test name is passed in then results are saved to CCI_TEST_RESULTS and CCI_TEST_WAIT_STATS from the previous run. The procedure always recreates all of the target CCI tables, resets the sequence, clears the buffer pool, and does a few other things.

CREATE OR ALTER PROCEDURE [dbo].[CCI_TEST_RESET] (@PreviousTestName NVARCHAR(100) = NULL, @DebugMe INT = 0)
AS
BEGIN
	DECLARE
	@tablename SYSNAME,
	@table_number INT = 1,
	@SQLToExecute NVARCHAR(4000);

	/*
CREATE TABLE CCI_TEST_WAIT_STATS (
	TEST_NAME NVARCHAR(100),
	WAIT_TYPE NVARCHAR(60),
	WAITING_TASKS_COUNT BIGINT,
	WAIT_TIME_MS BIGINT,
	MAX_WAIT_TIME_MS BIGINT,
	SIGNAL_WAIT_TIME_MS BIGINT
);

CREATE TABLE CCI_TEST_RESULTS (
	TEST_NAME NVARCHAR(100),
	TOTAL_SESSION_COUNT SMALLINT,
	TEST_DURATION INT,
	TOTAL_WORK_TIME INT,
	BEST_TABLE_TIME INT,
	WORST_TABLE_TIME INT,
	TOTAL_TABLES_PROCESSED SMALLINT,
	MIN_TABLES_PROCESSED SMALLINT,
	MAX_TABLES_PROCESSED SMALLINT
);
	*/

	SET NOCOUNT ON;

	IF @DebugMe = 0
	BEGIN
		DROP SEQUENCE IF EXISTS CCI_PARALLEL_TEST_SEQ;
		CREATE SEQUENCE CCI_PARALLEL_TEST_SEQ
			AS SMALLINT
			START WITH 1
			INCREMENT BY 1
			CACHE 600;

		IF @PreviousTestName  N''
		BEGIN
			INSERT INTO CCI_TEST_RESULTS WITH (TABLOCK)
			SELECT @PreviousTestName,
			  COUNT(*) TOTAL_SESSION_COUNT
			, DATEDIFF(MILLISECOND, MIN(MIN_START_TIME), MAX(MAX_END_TIME)) TEST_DURATION
			, SUM(TOTAL_SESSION_TIME) TOTAL_WORK_TIME
			, MIN(MIN_TABLE_TIME) BEST_TABLE_TIME
			, MAX(MAX_TABLE_TABLE) WORST_TABLE_TIME
			, SUM(CNT) TOTAL_TABLES_PROCESSED
			, MIN(CNT) MIN_TABLES_PROCESSED
			, MAX(CNT) MAX_TABLES_PROCESSED
			FROM (
				SELECT
				  SESSION_ID
				, COUNT(*) CNT
				, SUM(DATEDIFF(MILLISECOND, START_TIME, END_TIME)) TOTAL_SESSION_TIME
				, MIN(DATEDIFF(MILLISECOND, START_TIME, END_TIME)) MIN_TABLE_TIME
				, MAX(DATEDIFF(MILLISECOND, START_TIME, END_TIME)) MAX_TABLE_TABLE
				, MIN(START_TIME) MIN_START_TIME
				, MAX(END_TIME) MAX_END_TIME
				FROM CCI_TEST_LOGGING_TABLE
				GROUP BY SESSION_ID
			) t;

			INSERT INTO CCI_TEST_WAIT_STATS WITH (TABLOCK)
			SELECT @PreviousTestName, * FROM sys.dm_os_wait_stats
			WHERE wait_type IN (
				'RESERVED_MEMORY_ALLOCATION_EXT'
				, 'SOS_SCHEDULER_YIELD'
				, 'PAGEIOLATCH_EX'
				, 'MEMORY_ALLOCATION_EXT'
				, 'PAGELATCH_UP'
				, 'PAGEIOLATCH_SH'
				, 'WRITELOG'
				, 'LATCH_EX'
				, 'PAGELATCH_EX'
				, 'PAGELATCH_SH'
				, 'CMEMTHREAD'
				, 'LATCH_SH'
			);

		END;

		DROP TABLE IF EXISTS CCI_TEST_LOGGING_TABLE;
		CREATE TABLE CCI_TEST_LOGGING_TABLE (
			SESSION_ID INT,
			TABLE_NUMBER INT,
			START_TIME DATETIME,
			END_TIME DATETIME
		);

	END;

	WHILE @table_number BETWEEN 0 AND 576
	BEGIN
		SET @tablename = N'CCI_PARALLEL_RPT_TARGET_' + CAST(@table_number AS NVARCHAR(3));
		SET @SQLToExecute= N'DROP TABLE IF EXISTS ' + QUOTENAME(@tablename);
		IF @DebugMe = 1
		BEGIN
			PRINT @SQLToExecute;
		END
		ELSE
		BEGIN
			EXEC (@SQLToExecute);
		END;

		SET @SQLToExecute = N'SELECT * INTO ' + QUOTENAME(@tablename) +
		' FROM CCI_SOURCE WHERE 1 = 0';
		IF @DebugMe = 1
		BEGIN
			PRINT @SQLToExecute;
		END
		ELSE
		BEGIN
			EXEC (@SQLToExecute);
		END;

		SET @SQLToExecute = N'CREATE CLUSTERED COLUMNSTORE INDEX CCI ON ' + QUOTENAME(@tablename);
		IF @DebugMe = 1
		BEGIN
			PRINT @SQLToExecute;
		END
		ELSE
		BEGIN
			EXEC (@SQLToExecute);
		END;

		SET @table_number = @table_number + 1;
	END;

	IF @DebugMe = 0
	BEGIN
		DBCC DROPCLEANBUFFERS WITH NO_INFOMSGS;
		DBCC FREEPROCCACHE WITH NO_INFOMSGS;
		DBCC FREESYSTEMCACHE('ALL');

		SELECT COUNT(*) FROM CCI_SOURCE; -- read into cache

		DBCC SQLPERF ("sys.dm_os_wait_stats", CLEAR) WITH NO_INFOMSGS;
		DBCC SQLPERF ("sys.dm_os_spinlock_stats", CLEAR) WITH NO_INFOMSGS;
	END;
END;

Finally we need a stored procedure that can be called to do as many CCI inserts as it can as quickly as possible. I used the following code:

CREATE OR ALTER PROCEDURE [dbo].[CCI_RUN_INSERTS] (@DebugMe INT = 0)
AS
BEGIN
	DECLARE @table_number INT,
	@tablename SYSNAME,
	@SQLToExecute NVARCHAR(4000),
	@start_loop_time DATETIME;

	SET NOCOUNT ON;

	SELECT @table_number = NEXT VALUE FOR CCI_PARALLEL_TEST_SEQ;

	WHILE @table_number BETWEEN 0 AND 576
	BEGIN
		SET @start_loop_time = GETDATE();

		SET @tablename = N'CCI_PARALLEL_RPT_TARGET_' + CAST(@table_number AS NVARCHAR(3));
		SET @SQLToExecute= N'
		INSERT INTO ' + QUOTENAME(@tablename) + N' WITH (TABLOCK)
		SELECT * FROM CCI_SOURCE WITH (TABLOCK)
		OPTION (MAXDOP 1)';

		IF @DebugMe = 1
		BEGIN
			PRINT @SQLToExecute;
		END
		ELSE
		BEGIN
			EXEC (@SQLToExecute);

			INSERT INTO CCI_TEST_LOGGING_TABLE VALUES (@@SPID, @table_number, @start_loop_time, GETDATE());
		END;

		SELECT @table_number = NEXT VALUE FOR CCI_PARALLEL_TEST_SEQ;
	END;
END;

To vary the number of concurrent queries I used sqlcmd. Each set of 12 sessions had the following format:

START /B sqlcmd -d your_db_name -S your_server_name -Q "EXEC dbo.[CCI_RUN_INSERTS]" > nul
ping 192.2.0.1 -n 1 -w 1 > nul

My workflow was to perform this test was to add the desired number of calls to the stored procedure in the .bat file, run the test, and to check the results to make sure that the test was a good one. If it was I saved off results using the reset procedure. If not I ran the reset procedure and tried again.

The ping command is there to add a small delay between sets of queries. I found that adding such a delay led to less doubling up on schedulers. I picked 12 because that’s the number of soft-NUMA nodes. Sometimes tests would get quite a bit of SOS_SCHEDULER_YIELD waits which would mean that they couldn’t be accurately compared to other tests. My fix was to just run the test again. It required a bit of patience but I never had to run a test more than once. SOS waits weren’t eliminated but I’d say they fell to acceptable levels:

a27_SOS_CPU_wait_table

The right way to avoid SOS waits for testing like this (which might require every user session to go on its own scheduler) would be to set up 96 manual soft-NUMA nodes. But who has time for that?

Test Results

12 tests with different numbers of active queries were run. I picked numbers that somewhat evenly divided into 576 to try to keep work balanced between threads. The blue line in the chart below measures how long each test took from start to finish and the orange line represents how fast the test could have completed if there was no contention on the server whatsoever:

a27_No_T834_compare_chart

Naturally we can’t expect the two lines to match perfectly, but improvements in runtime stop after going past 32 threads. In fact, the workload takes longer with 96 threads compared to 32 threads.

The dominant wait event for the higher thread count runs is RESERVED_MEMORY_ALLOCATION_EXT. Below is a chart of all of the wait events worth mentioning for the 96 thread run:

a27_no_T834_wait_table

The total number of wait events for RESERVED_MEMORY_ALLOCATION_EXT is very consistent between runs. However, the average wait time significantly increases as the number of concurrent queries increases:

a27_memory_waits_chart

In fact, it could be said that that nearly all worker time past 32 threads is spent waiting on memory. The final column in the chart below is the total time spent in SQL Server minus wait time for RESERVED_MEMORY_ALLOCATION_EXT. The values in that column are remarkably consistent.

a27_No_TF_834_summary

In my experience, when we get into a situation with high memory waits caused by too much concurrent CCI activity all queries on the server that use a memory grant can be affected. For example, I’ve seen sp_whoisactive run for longer than 90 seconds.

It needs to be stated that not all CCIs will suffer from this scalability problem. I was able to achieve good scalability with some artificial tables, but all of the real target tables that I tested have excessive memory waits at high concurrency. Perhaps tables which require more CPU to compress naturally spread out their memory requests and the underlying OS is better able to keep up.

Test Results With Trace Flag 834

Microsoft strongly recommends against using trace flag 834 with columnstore tables. There’s even an article dedicated to that warning. I was desperate so I tried it anyway. The difference was night and day:

a27_T834_compare_chart

Enabling trace flag 834 does at least three things: SQL Server grows to max server memory on startup, AWE memory is used for memory access, and large pages are used for the buffer pool. I didn’t see gains when using LPIM (which uses AWE memory) or by growing memory to max before running tests with a conventional memory model, so I suspect that the large pages are making a key difference. Wait time for RESERVED_MEMORY_ALLOCATION_EXT is under a second for all tests.

Scalability is diminished a bit for the 96 thread run. There are some wait events that creep up:

TF_834_96_thread_wait_stats

All of the wait events can be troubleshooted in conventional ways except possibly for CMEMTHREAD. There’s no longer a large amount of time spent outside of SQL Server in the OS.

Other Workarounds

Without trace flag 834 this can be a difficult problem to work around. The two main strategies are to spread out CCI insert activity as much as possible during the ETL and to reduce memory usage of queries which run at the same time as the CCI inserts. For example, consider a query that inserts into a CCI that also performs a large hash join. If that hash join can be moved to somewhere else in the process then you might come out ahead in reducing contention on memory.

Other than that, there’s some evidence that virtualized servers are not a good fit for this type of workload. Large virtual guests experience the memory waits at an increased rate, but it isn’t yet clear if the problem can be avoided through some change in VM configuration.

Final Thoughts

It’s hard not to conclude that TF 834 is necessary to get scalability for columnstore ETLs on very large servers. Hopefully Microsoft will make TF 834 compatible with columnstore one day in the future. Thanks for reading!

Columnstore Bitmap Filters

Microsoft has introduced a few improvements to bitmap filters with batch mode. I don’t really define any terms in this post, so if you don’t have a solid grasp of the fundamentals you should consider this blog post by Paul White required reading.

Test Data

Let’s start with a few simple examples that don’t involve columnstore. All of the test queries are simple joins between a dimension and a fact table on a DATETIME column. I’ll use the same dimension table for all of them:

DROP TABLE IF EXISTS dbo.DimDim;

CREATE TABLE dbo.DimDim (
	dimDate DATETIME,
	PRIMARY KEY (dimDate)
);

INSERT INTO dbo.DimDim VALUES
('20170101'),
('20170102'),
('20170103'),
('20170104'),
('20170105'),
('20170106'),
('20170107'),
('20170108'),
('20170109'),
('20170110'),
('20171201'),
('20171202'),
('20171203'),
('20171204'),
('20171205'),
('20171206'),
('20171207'),
('20171208'),
('20171209'),
('20171210');

Twenty rows in total with 10 dates in January and 10 dates in December. Obviously this isn’t a proper dimension table, but it makes the demos a little simpler. The fact tables have about a million rows in all twelve months of 2017 for a total of about 12 million rows.

Rowstore Heaps

Let’s start with a rowstore heap for the fact table. Code to create and populate the table is below:

DROP TABLE IF EXISTS dbo.FactHeapNoPart;

CREATE TABLE dbo.FactHeapNoPart (
	factDate DATETIME,
	justTheFacts VARCHAR(100)
);

DECLARE @month INT = 1;
SET NOCOUNT ON;

WHILE @month <= 12
BEGIN
	INSERT INTO dbo.FactHeapNoPart
		WITH (TABLOCK)
	SELECT DATEADD(DAY, t.RN / 38500
	, DATEADD(MONTH, @month, '20161201'))
	, REPLICATE('FACTS', 20)
	FROM
	(
		SELECT TOP (1048576) ROW_NUMBER()
			OVER (ORDER BY (SELECT NULL)) RN
		FROM master..spt_values t1
		CROSS JOIN master..spt_values t2
	) t
	OPTION (MAXDOP 1);

	SET @month = @month + 1;
END;

The first demo query is forced to run in serial:

SELECT *
FROM dbo.DimDim dd
INNER JOIN dbo.FactHeapNoPart f
	ON dd.dimDate = f.factDate
OPTION (MAXDOP 1);

With a serial query there is no visible bitmap operator as expected:

a23_rowstore_heap_serial

On my machine, the query requires 190656 logical reads and 2234 ms of CPU time to execute.

Bumping the query up to MAXDOP 2 results in a bitmap operator:

a23_rowstore_heap_parallel

The bitmap operator isn’t pushed in row due to the data type, but only 769998 rows are sent to the hash match as a result. CPU time required to execute the query falls to 1844 and logical reads stays the same. We did the same amount of IO, which seems perfectly reasonable here.

Rowstore Clustered Indexes

It’s not a very common plan type, but what happens with a hash join on the clustered key of a rowstore table? The code below creates a fact table with the same data as before but now we have a clustered index:

DROP TABLE IF EXISTS dbo.FactClustNoPart;

CREATE TABLE dbo.FactClustNoPart (
	factDate DATETIME,
	justTheFacts VARCHAR(100)
);

CREATE CLUSTERED INDEX CI ON FactClustNoPart (factDate);

DECLARE @month INT = 1;
SET NOCOUNT ON;

WHILE @month <= 12
BEGIN
	INSERT INTO dbo.FactClustNoPart
		WITH (TABLOCK)
	SELECT DATEADD(DAY, t.RN / 38500
	, DATEADD(MONTH, @month, '20161201'))
	, REPLICATE('FACTS', 20)
	FROM
	(
		SELECT TOP (1048576) ROW_NUMBER()
			OVER (ORDER BY (SELECT NULL)) RN
		FROM master..spt_values t1
		CROSS JOIN master..spt_values t2
	) t
	OPTION (MAXDOP 1);

	SET @month = @month + 1;
END;

All rows are again read from the fact table. The bitmap operator isn’t quite as effective as before. 798498 rows are sent to the join but only 769998 remain after the join.

Could SQL Server do better? Building the hash table is a blocking operator and it should be trivial to keep track of the minimum and maximum join key while building it. In theory, one could imagine a plan with a clustered index seek on the fact table instead of a clustered index scan that takes advantage of the minimum and maximum values found during the hash build phase. This optimization would result in less overall IO. Perhaps this wasn’t implemented because this isn’t a very common plan shape.

Rowstore Partitioned Heaps

Now let’s move onto to a partitioned rowstore heap for the fact table. There is one partition per month and 12 partitions end up with data. Code to create and populate the table is below:

CREATE PARTITION FUNCTION hate_this_syntax_fun
(DATETIME)
AS RANGE RIGHT
FOR VALUES (
  '20161231'
, '20170101'
, '20170201'
, '20170301'
, '20170401'
, '20170501'
, '20170601'
, '20170701'
, '20170801'
, '20170901'
, '20171001'
, '20171101'
, '20171201'
, '20180101'
);

CREATE PARTITION SCHEME hate_this_syntax_scheme
AS PARTITION hate_this_syntax_fun
ALL TO ( [PRIMARY] );

DROP TABLE IF EXISTS dbo.FactHeapPart;

CREATE TABLE dbo.FactHeapPart (
	factDate DATETIME,
	justTheFacts VARCHAR(100)
) ON hate_this_syntax_scheme (factDate);
set statistics io, time on;

DECLARE @month INT = 1;
SET NOCOUNT ON;

WHILE @month <= 12
BEGIN
	INSERT INTO dbo.FactHeapPart
		WITH (TABLOCK)
	SELECT t2.factDate, t2.justTheFacts
	FROM
	(
		SELECT CAST(
			DATEADD(DAY, CAST(t.RN / 38500 AS INT)
			, DATEADD(MONTH, @month, '20161201')
			) AS DATETIME) factDate
		, REPLICATE('FACTS', 20) justTheFacts
		FROM
		(
			SELECT TOP (1048576) ROW_NUMBER()
				OVER (ORDER BY (SELECT NULL)) RN
			FROM master..spt_values t1
			CROSS JOIN master..spt_values t2
		) t
	) t2
	--WHERE $PARTITION.hate_this_syntax_fun(t2.factDate) = @month + 2
	OPTION (MAXDOP 1);

	SET @month = @month + 1;
END;

The code above takes a bit longer to execute than I would have liked. There’s a sort before inserting data even with a filter on the partitioning function. I’m not sure why I couldn’t make the sort go away. I expect that it has something to do with data types.

Running the same query as before:

SELECT *
FROM dbo.DimDim dd
INNER JOIN dbo.FactHeapPart f
	ON dd.dimDate = f.factDate
OPTION (MAXDOP 2);

The plan looks the same as before. The bitmap sends 790371 rows to the hash join. One thing to note is that all partitions are read from the table:

a23_all_partitions

We know that based on the data in the dimension table that SQL Server only needs to read two partitions from the fact table. Could the query optimizer in theory do better than it did? Consider the fact that a partitioned table has at most 15000 partitions. All of the partition values cannot overlap and they don’t change without a DDL operation. When building the hash table the query optimizer could keep track of which partitions have at least one row in them. By the end of the hash build we’ll know exactly which partitions could contain data, so the rest of the partitions could be skipped during the probe phase.

Perhaps this isn’t implemented because it’s important for the hash build to be independent of the probe. Maybe there’s no guarantee available at the right time that the bitmap operator will be pushed all the way down to the scan as opposed to a repartition streams operator. Perhaps this isn’t a common case and the optimization isn’t worth the effort. After all, how often do you join on the partitioning column instead of filtering by it?

It’s worth noting that the theoretical optimization described above still isn’t as good as the collocated join optimization blogged about by Paul White.

Columnstore

Now let’s build a columnstore index with 1048576 rows per rowgroup:

DROP TABLE IF EXISTS dbo.FactCCINoPart;

CREATE TABLE dbo.FactCCINoPart (
	factDate DATETIME,
	justTheFacts VARCHAR(100),
	INDEX CCI CLUSTERED COLUMNSTORE
);

DECLARE @month INT = 1;
SET NOCOUNT ON;

WHILE @month <= 12
BEGIN
	INSERT INTO dbo.FactCCINoPart
		WITH (TABLOCK)
	SELECT t2.factDate, t2.justTheFacts
	FROM
	(
		SELECT CAST(
			DATEADD(DAY, CAST(t.RN / 38500 AS INT)
			, DATEADD(MONTH, @month, '20161201')
			) AS DATETIME) factDate
		, REPLICATE('FACTS', 20) justTheFacts
		FROM
		(
			SELECT TOP (1048576) ROW_NUMBER()
				OVER (ORDER BY (SELECT NULL)) RN
			FROM master..spt_values t1
			CROSS JOIN master..spt_values t2
		) t
	) t2
	OPTION (MAXDOP 1);

	SET @month = @month + 1;
END;

Let’s return to our serial join query:

SELECT *
FROM dbo.DimDim dd
INNER JOIN dbo.FactCCINoPart f
	ON dd.dimDate = f.factDate
OPTION (MAXDOP 1);

A few interesting things happen. The first is that we get rowgroup elimination even though the dates in the dimension table are spread very far apart:

Table ‘FactCCINoPart’. Segment reads 2, segment skipped 10.

The following simple query doesn’t get rowgroup elimination:

SELECT *
FROM dbo.FactCCINoPart f
WHERE f.factDate IN ('20170101', '20171231')

You can read more about that limitation here. It’s fair to say that the bitmap filter does a better job than expected with rowgroup elimination. According to extended events this is known as an expression filter bitmap. The extended event has a few undocumented properties about the bitmap:

a23_cs bitmap_xe

I watched the extended events fly by a few times but it wasn’t clear to me what was going on internally. One possible implementation would be for the hash build to compare each build row to the rowgroup low and high values to figure out which rowgroups could never possibly return matched rows. I strongly suspect that is not the implementation that Microsoft chose. Perhaps they take advantage of the small expected size of the bitmap filter to send information about all of the build rows to do elimination. I don’t know a lot about computer science, but the usual structure of bitmap would not be sufficient because you can’t use such a bitmap to make any determination about inequality comparisons. It can only tell you if an individual row can’t match.

The second interesting thing is that we get an optimized bitmap even for a serial plan:

a23_CCI_opt_bitmap

Optimized Bitmaps

At some point optimized bitmaps were limited to parallel plans. I suspect that restriction was relaxed with the availability of batch mode in a plan but I don’t know for sure. The demos below show optimized bitmaps both improving and degrading performance. The script below creates three tables and takes about three minutes to run on my machine:

DROP TABLE IF EXISTS #t;

SELECT TOP (3000000) ROW_NUMBER()
	OVER (ORDER BY (SELECT NULL)) RN into #t
FROM master..spt_values t1
CROSS JOIN master..spt_values t2;

-- rowstore dim with an index
-- that includes DimForeignKey
DROP TABLE IF EXISTS dbo.RSJoinIndex;
CREATE TABLE dbo.RSJoinIndex (
	IrrelevantKey BIGINT,
	SelectKey BIGINT,
	DimForeignKey BIGINT,
	FilterIndexed INT,
	PageFiller VARCHAR(3000),
	PRIMARY KEY (IrrelevantKey)
);

INSERT INTO dbo.RSJoinIndex WITH (TABLOCK)
SELECT t.RN, 1, t.RN, 1, REPLICATE('Z', 3000)
FROM #t t
OPTION (MAXDOP 1);

CREATE INDEX IX_RSJoinIndex ON dbo.RSJoinIndex
	(FilterIndexed) INCLUDE (DimForeignKey);
CREATE STATISTICS S1 ON dbo.RSJoinIndex (DimForeignKey)
	WITH FULLSCAN;

-- rowstore dim with an index
-- that does not include DimForeignKey
DROP TABLE IF EXISTS dbo.RSNoJoinIndex;
CREATE TABLE dbo.RSNoJoinIndex (
	IrrelevantKey BIGINT,
	SelectKey BIGINT,
	DimForeignKey BIGINT,
	FilterIndexed INT,
	PageFiller VARCHAR(3000),
	PRIMARY KEY (IrrelevantKey)
);

INSERT INTO dbo.RSNoJoinIndex WITH (TABLOCK)
SELECT t.RN, 1, t.RN, 1, REPLICATE('Z', 3000)
FROM #t t
OPTION (MAXDOP 1);

CREATE INDEX IX_RSNoJoinIndex ON dbo.RSNoJoinIndex
	(FilterIndexed);
CREATE STATISTICS S1 ON dbo.RSNoJoinIndex (DimForeignKey)
	WITH FULLSCAN;

-- CCI fact table
DROP TABLE IF EXISTS dbo.CCIFact;
CREATE TABLE dbo.CCIFact (
	DimForeignKey BIGINT,
	FilterCol BIGINT,
	INDEX CCI CLUSTERED COLUMNSTORE
);

INSERT INTO dbo.CCIFact WITH (TABLOCK)
SELECT t.RN , 1 + t.RN % 1000
FROM #t t
OPTION (MAXDOP 1);

CREATE STATISTICS S1 ON dbo.CCIFact (DimForeignKey)
	WITH FULLSCAN;
CREATE STATISTICS S2 ON dbo.CCIFact (FilterCol)
	WITH FULLSCAN;

All tables have three million rows and the join between them results in 3000 rows. RSJoinIndex is a rowstore table with 3 million rows that contains the join column in a nonclustered index. RSNoJoinIndex is a rowstore table without the join column in a nonclustered index. CCIFact is a columnstore table with three million rows.

Optimized Bitmaps Gone Right

Consider the following query:

SELECT table0.SelectKey
FROM dbo.RSNoJoinIndex AS table0
INNER JOIN dbo.CCIFact AS table1
ON table0.DimForeignKey = table1.DimForeignKey
WHERE table0.FilterIndexed = 1
  AND table1.FilterCol = 1 -- 0.1% of the data
OPTION (MAXDOP 1);

The RSNoJoinIndex table has an index with a key column of FilterIndexed and an included column of DimForeignKey. Here’s the plan that I get:

a23_final_good_bitmap

The CCI is used as the build for the hash join. The highlighted filter is an optimized bitmap that’s applied after the index seek but before the key lookup to get the SelectKey column. The bitmap reduces the number of required key lookups from 3000000 to just 3000. The query executes and requires 21874 logical reads from the rowstore table and 437 ms of CPU time on my machine.

Overall this is a reasonable plan and an effective application of a bitmap filter.

Optimized Bitmaps Gone Wrong

Let’s query the table without the join column in the index:

SELECT table0.SelectKey
FROM dbo.RSNoJoinIndex AS table0
INNER JOIN dbo.CCIFact AS table1
ON table0.DimForeignKey = table1.DimForeignKey
WHERE table0.FilterIndexed = 1
  AND table1.FilterCol = 1 -- 0.1% of the data
OPTION (MAXDOP 1);

Here’s the plan:

a23_final_bad_bitmap

The position of the bitmap has changed so that it’s evaluated after the key lookup. That makes sense because the key lookup returns the column to be filtered against. However, the bitmap filter still reduces the estimated number of key lookups from 3000000 to 3000. This is impossible. The filter can only be applied after the key lookup, so it does not make sense for the bitmap to reduce the number of estimated executions of the key lookup.

Performance is significantly worse with the query now requiring 12199107 logical reads from the rowstore table and 13406 CPU time overall. We can see that the query did three million key lookups:

a23_3M_Keylookups

I could only get this type of plan to appear with a columnstore index somewhere present in the query. It can be triggered even with two rowstore tables as long as the query is batch mode eligible. I’ve filed a connect item for this issue. Please vote if you have a moment.

Final Thoughts

Batch mode and columnstore have brought some interesting (and as far as I can tell, undocumented) improvements to bitmap filters. Thanks for reading!

A Columnstore Compression Magic Trick

Columnstore compression is complicated, and in some cases, surprising.

The Setup

The source data for the CCI has enough rows to fit six perfect rowgroups. The ID column is just sequential integers from 1 to 6291456. The ID2 column is the ID column modulo 20001. Code to load the data into a temp table:


<span 				data-mce-type="bookmark" 				id="mce_SELREST_end" 				data-mce-style="overflow:hidden;line-height:0" 				style="overflow:hidden;line-height:0" 			></span>
DROP TABLE IF EXISTS #STG_DATA;
CREATE TABLE #STG_DATA (
	ID BIGINT NOT NULL,
	ID2 BIGINT NOT NULL,
	PRIMARY KEY (ID)
);

INSERT INTO #STG_DATA WITH (TABLOCK)
SELECT t.RN, t.RN % 20001
FROM
(
	SELECT TOP (6 * 1048576) ROW_NUMBER()
		OVER (ORDER BY (SELECT NULL)) RN
	FROM master..spt_values t1
	CROSS JOIN master..spt_values t2
) t;

Here’s the table definition for the target CCI:

DROP TABLE IF EXISTS dbo.TARGET_CCI;
CREATE TABLE dbo.TARGET_CCI (
	ID2 BIGINT NOT NULL,
	ID BIGINT NOT NULL,
	INDEX CCI CLUSTERED COLUMNSTORE
);

The reversal of column order is important for the demo below.

Changing MAXDOP

First let’s load the ID2 column the temp table into the CCI. The order of data can matter for compression so I have a superfluous TOP expression to force SQL Server to read the data in clustered key order.

INSERT INTO dbo.TARGET_CCI WITH (TABLOCK)
SELECT TOP (9876543210) ID2, 0
FROM #STG_DATA
ORDER BY ID
OPTION (MAXDOP 1);

The insert query takes 2765 ms of CPU time and 2771 ms of elapsed time on my machine. According to sys.dm_db_column_store_row_group_physical_stats each rowgroup has a size of 2098320 bytes:

a20_maxdop_1_rg_dmv

Now let’s move on to a parallel insert query with MAXDOP 2. The purpose of the second column in the CCI is to make the insert go parallel on my machine. It’s possible that you’ll need to use trace flag 8649 or some other trick to get a parallel insert. Here’s the code that I ran:

TRUNCATE TABLE dbo.TARGET_CCI;

INSERT INTO dbo.TARGET_CCI WITH (TABLOCK)
SELECT TOP (9876543210) ID2, 0
FROM #STG_DATA
ORDER BY ID
OPTION (MAXDOP 2);

The insert query now takes 3594 ms of CPU time and 2112 ms of elapsed time on my machine. The size of each rowgroup did not change. It’s still 2098320 bytes. Even though this is a parallel query there’s no element of randomness in this case. In the query plan we can see that the source table was scanned in a serial zone and round robin distribution is to used to distribute exactly half of the rows to each parallel thread.

a20_parallel_insert

This seems like a reasonable plan given that TOP forces a serial zone and we need to preserve order. It’s possible to rewrite the query to encourage a parallel scan of the source table, but that would introduce an order-preserving gather streams operator.

I’m not satisfied with the runtime yet, so I’m going to bump up MAXDOP to 3:

TRUNCATE TABLE dbo.TARGET_CCI;

INSERT INTO dbo.TARGET_CCI WITH (TABLOCK)
SELECT TOP (9876543210) ID2, 0
FROM #STG_DATA
ORDER BY ID
OPTION (MAXDOP 3);

The insert query now takes 114172 ms of CPU time and 39208 ms of elapsed time to execute. However, each rowgroup now is just 54496 bytes.

a20_maxdop_3_rg_dmv

The INSERT took significantly longer than before, but we have 38X better compression compared to the table after the MAXDOP 2 query. What happened?

Revealing the Magic Trick

An interesting pattern for compressed data sizes appears when working with repeated integers for a single rowgroup. The query that I tested with was roughly of the following format:

INSERT INTO dbo.CCI
SELECT t.RN % @MOD_NUM
FROM
(
	SELECT TOP (@ROWS_INSERTED)
		ROW_NUMBER()
		OVER (ORDER BY (SELECT NULL)) RN
	FROM master..spt_values t1
	CROSS JOIN master..spt_values t2
) t;

Below is a contour plot that shows how the compressed size for a single rowgroup varies as the number of rows and the modulus value changes:

a20_contour_size

Values that are repeated 64 or more times seem to be compressed much better than other values. This pattern definitely doesn’t always hold as you add more columns to the table which is why I made the ID2 column the first column in the target CCI. Why is this pattern relevant to the previous example?

Consider the MAXDOP 1 insert query. With a full rowgroup of 1048576 rows a value will be repeated at most 1048576/20001 = 53 times in each rowgroup. It doesn’t cross the threshold of 64 so we end up with a compressed size of 2098320 bytes.

Now consider the MAXDOP 2 insert query. The ordered data from the scan is distributed using round robin distribution on two threads. For the first 20001 rows from the scan, thread 0 gets all even values and thread 1 gets all odd values. For the next 20001 rows, thread 0 gets all odd values and thread 1 gets all even values. This occurs because 20001 isn’t divisible by 2. For all six compressed rowgroups we end up with the same data distribution as we had when doing MAXDOP 1 inserts. It makes sense that the compressed size remained at 2098320 bytes.

Now consider the MAXDOP 3 insert query. The query still uses round robin distribution but there are now three threads. 20001 is divisible by 3 so thread 0 only ends up with 6667 unique values from 0, 3, … to 19999. Thread 1 also ends up with 6667 unique values from 1, 4, … to 20000. Thread 2 follows a similar pattern. Each compressed rowgroup only has 6667 unique values instead of 20001. Each value shows up at least 157 times in the rowgroup, so all of the data qualifies for much better compression.

Final Thoughts

This has absolutely no practical value. Thanks for reading!

ROWGROUP_FLUSH Deadlocks

We recently observed many ROWGROUP_FLUSH deadlocks while doing concurrent inserts into CCIs. I’m not really a concurrency kind of guy but I figured that I should blog about this just so other people with the same problem can find some information about it.

Deadlock Reproduction

The schedulers of the involved sessions are important in some way, especially when going for a simple reproduction. It’s easiest to just make all new sessions go the same CPU:

ALTER SERVER CONFIGURATION
SET PROCESS AFFINITY CPU = 0;

Obviously you should never do that in production. After affinity has been addressed I recommend creating a nearly empty source table and a new CCI table:

DROP TABLE IF EXISTS dbo.CCI_DEADLOCKED;
CREATE TABLE dbo.CCI_DEADLOCKED (
	COL VARCHAR(1500),
	INDEX CCI CLUSTERED COLUMNSTORE
);

CREATE TABLE ##SOURCE_IDS (ID BIGINT NOT NULL);

INSERT INTO ##SOURCE_IDS WITH (TABLOCK)
SELECT TOP (1048576) ROW_NUMBER()
	OVER (ORDER BY (SELECT NULL))
FROM master..spt_values t1
CROSS JOIN master..spt_values t2
OPTION (MAXDOP 1);

One way to see the deadlock is to quickly kick off two inserts into the CCI_DEADLOCKED table from different sessions. Inserting a larger amount of data means that you’ll have more time to kick off the second session before the first completes, but a longer rollback time on the first session. On my machine inserting 1048576 rows of VARCHAR(1500) data seems like a reasonable compromise:

INSERT INTO dbo.CCI_DEADLOCKED
SELECT REPLICATE('Z', 1500)
FROM ##SOURCE_IDS
OPTION (MAXDOP 1, MAX_GRANT_PERCENT = 0);

The second session waits on the first with a LCK_M_IX wait event. The first session loads all of its rows into the delta store, then deadlocks and rolls them all back. You can see this happen in near real time by looking at  sys.dm_db_column_store_row_group_physical_stats:

a19_disappearing_delta_store_rows

Here’s the deadlock XML for those who are interested in that kind of thing:

<?xml version="1.0" encoding="UTF-8"?>
<deadlock>
   <victim-list>
      <victimProcess id="process250c6d59c28" />
   </victim-list>
   <process-list>
      <process id="process250c6d59c28" taskpriority="0" logused="0" waitresource="HOBT: 5:72057594084917248 [ROWGROUP_FLUSH]" waittime="3635" ownerId="8986700" transactionname="CloseDeltastore" lasttranstarted="2017-11-12T16:51:53.260" XDES="0x250b572c490" lockMode="X" schedulerid="1" kpid="6288" status="suspended" spid="56" sbid="0" ecid="0" priority="0" trancount="2" lastbatchstarted="2017-11-12T16:51:42.827" lastbatchcompleted="2017-11-12T16:51:42.827" lastattention="1900-01-01T00:00:00.827" clientapp="Microsoft SQL Server Management Studio - Query" hostname="???????" hostpid="4404" loginname="???????\?" isolationlevel="read committed (2)" xactid="8775106" currentdb="5" lockTimeout="4294967295" clientoption1="671090784" clientoption2="390200">
         <executionStack>
            <frame procname="adhoc" line="1" stmtend="238" sqlhandle="0x020000004d878e20b5b8d311601f91ebfeb1174f657907d00000000000000000000000000000000000000000">unknown</frame>
         </executionStack>
         <inputbuf>INSERT INTO dbo.CCI_DEADLOCKED  SELECT REPLICATE('Z', 1500)  FROM ##SOURCE_IDS  OPTION (MAXDOP 1, MAX_GRANT_PERCENT = 0);</inputbuf>
      </process>
      <process id="process250bacf04e8" taskpriority="0" logused="168" waitresource="HOBT: 5:72057594085179392 " waittime="13628" ownerId="8785145" transactionname="INSERT" lasttranstarted="2017-11-12T16:51:43.267" XDES="0x2508f1ac040" lockMode="IX" schedulerid="1" kpid="6856" status="suspended" spid="54" sbid="0" ecid="0" priority="0" trancount="2" lastbatchstarted="2017-11-12T16:51:43.267" lastbatchcompleted="2017-11-12T16:51:43.250" lastattention="1900-01-01T00:00:00.250" clientapp="Microsoft SQL Server Management Studio - Query" hostname="???????" hostpid="4404" loginname="???????\?" isolationlevel="read committed (2)" xactid="8785145" currentdb="5" lockTimeout="4294967295" clientoption1="671090784" clientoption2="390200">
         <executionStack>
            <frame procname="adhoc" line="1" stmtend="238" sqlhandle="0x020000004d878e20b5b8d311601f91ebfeb1174f657907d00000000000000000000000000000000000000000">unknown</frame>
         </executionStack>
         <inputbuf>INSERT INTO dbo.CCI_DEADLOCKED  SELECT REPLICATE('Z', 1500)  FROM ##SOURCE_IDS  OPTION (MAXDOP 1, MAX_GRANT_PERCENT = 0);</inputbuf>
      </process>
   </process-list>
   <resource-list>
      <hobtlock hobtid="72057594084917248" subresource="ROWGROUP_FLUSH" dbid="5" objectname="D1.dbo.CCI_DEADLOCKED" indexname="CCI" id="lock250b52ab400" mode="S" associatedObjectId="72057594084917248">
         <owner-list>
            <owner id="process250bacf04e8" mode="S" />
         </owner-list>
         <waiter-list>
            <waiter id="process250c6d59c28" mode="X" requestType="wait" />
         </waiter-list>
      </hobtlock>
      <hobtlock hobtid="72057594085179392" subresource="FULL" dbid="5" objectname="D1.dbo.CCI_DEADLOCKED" indexname="CCI" id="lock250b5b8a280" mode="X" associatedObjectId="72057594085179392">
         <owner-list>
            <owner id="process250c6d59c28" mode="X" />
         </owner-list>
         <waiter-list>
            <waiter id="process250bacf04e8" mode="IX" requestType="convert" />
         </waiter-list>
      </hobtlock>
   </resource-list>
</deadlock>

SSMS can’t produce a deadlock graph for this type of deadlock. Below is the non-copy-and-pastable error message from it:

Failed to initialize deadlock control.
There is an error in XML document (1, 2497).
Instance validation error: ‘ROWGROUP_FLUSH’ is not a valid value for hobtlockSubresource.

Plan Explorer from SentryOne can help us:

a19_deadlock_graph

If you’re following along at home don’t forget to reset your affinity to whatever you had it before. The most common option:

ALTER SERVER CONFIGURATION
SET PROCESS AFFINITY CPU = AUTO;

The Workarounds

We’ve only observed this deadlock with multiple concurrent sessions insert to the delta store for the same target CCI due to server memory pressure or very low cardinality estimates (less than 251 rows). The correct mitigation depends on why you’re seeing the issue in the first place. If you’re seeing it due to low cardinality estimates then fix your estimates, or at the very least get them above 250 rows. If you’re seeing them because the memory grant for the CCI build times out after 25 seconds then lower concurrency or increase server memory.

The problem can also be avoided by not doing concurrent inserts in the first place. In some cases a parallel insert may be a reasonable alterative. There’s also some evidence that the deadlock is only seen when the number of rows for insert is very close to 1048576, but we weren’t able to make any definitive conclusions around that.

Final Thoughts

Don’t despair if you run into a ROWGROUP_FLUSH deadlock! There’s probably something you can do in the application to avoid it. If you feel that you shouldn’t have to take such measures feel free to vote for my connect item here.


Surprise Delta Stores

This post contains all of the possible causes for delta store creation that I’ve found. I cannot say with certainty that it’s a complete list, but some of them may be new or unexpected to the reader.

Why Care about Delta Stores?

Microsoft and many others will be quick to tell you that loading data into CCIs is much faster when you can bypass the delta store. In SQL Server 2016 and beyond, delta stores are uncompressed rowstore mini-tables that serve as a temporary holding data until the data can be compressed into columnar format. They’re good when you have a trickle of data to load into a CCI, but bad in all possible ways for a data warehouse workload.

Reviewing the Documentation

I briefly reviewed the documentation written by Microsoft concerning the appearance of delta stores. Here’s a quote:

Rows go to the deltastore when they are:
Inserted with the INSERT INTO VALUES statement.
At the end of a bulk load and they number less than 102,400.
Updated. Each update is implemented as a delete and an insert.

There are also a few mentions of how partitioning can lead to the creation of multiple delta stores from a single insert. It seems as if the document is incomplete or a little misleading, but I admit that I didn’t exhaustively review everything. After all, Microsoft hides columnstore documentation all over the place.

Test Data

The source data for the CCI inserts is fairly uninteresting. I put four rowgroups worth of rows into a rowstore table with a BIGINT column and a randomly generated VARCHAR(16) value.

DROP TABLE IF EXISTS dbo.STAGING_TABLE;

CREATE TABLE dbo.STAGING_TABLE (
	ID BIGINT NOT NULL,
	STR1 VARCHAR(16) NOT NULL,
	PRIMARY KEY (ID)
);

INSERT INTO dbo.STAGING_TABLE WITH (TABLOCK)
SELECT TOP (4 * 1048576)
  ROW_NUMBER() OVER (ORDER BY (SELECT NULL))
, LEFT(CAST(NEWID() AS VARCHAR(36)), 16)
FROM master..spt_values t1
CROSS JOIN master..spt_values t2
OPTION (MAXDOP 1);

The columns for the table definition for the CCI were chosen to cover all of the demos except for the partitioning one. Your fact table definitions probably don’t look like this.

DROP TABLE IF EXISTS dbo.DELTA_STORE_DUMPING_GROUND;
CREATE TABLE dbo.DELTA_STORE_DUMPING_GROUND (
	ID BIGINT NULL,
	STR1 VARCHAR(100) NULL,
	STR2 VARCHAR(100) NULL,
	STR3 VARCHAR(100) NULL,
	STR1_MAX VARCHAR(MAX) NULL,
	INDEX CCI CLUSTERED COLUMNSTORE
);

Not Enough Rows For Bulk Load

The first reason for delta creation is well known and understood on SQL Server 2016. If you insert fewer than 102400 rows then SQL Server will not attempt to skip the delta store. This behavior is by design. The following query does not do a bulk load:

INSERT INTO dbo.DELTA_STORE_DUMPING_GROUND (ID)
SELECT TOP (102399) ID
FROM dbo.STAGING_TABLE
ORDER BY ID
OPTION (MAXDOP 1);

We can see the delta store that was just created with the following query:

SELECT
    row_group_id
  , state_desc
  , total_rows
--, trim_reason_desc
--, deleted_rows
--, partition_number
FROM sys.dm_db_column_store_row_group_physical_stats rg
INNER JOIN sys.tables t ON rg.OBJECT_ID = t.OBJECT_ID
WHERE t.name = 'DELTA_STORE_DUMPING_GROUND';

The results:

a18_dmv_1

The other examples in this post use similar queries to get information about the newly added rowgroups to the table. They will be omitted for brevity. Simply inserting one row results in the delta store getting skipped:

TRUNCATE TABLE dbo.DELTA_STORE_DUMPING_GROUND;

INSERT INTO dbo.DELTA_STORE_DUMPING_GROUND (ID)
SELECT TOP (102400) ID
FROM dbo.STAGING_TABLE
ORDER BY ID
OPTION (MAXDOP 1);

Now the rowgroup is compressed:

a18_dmv_2

The rules change slightly in SQL Server 2017 with support of VARCHAR(MAX) and other LOB columns in columnstore. The delta store can be skipped with an insert of as few as 251 rows. Whether or not you write to the delta store depends on the amount of data being written. Below is one query that still writes to the delta store:

TRUNCATE TABLE dbo.DELTA_STORE_DUMPING_GROUND;

INSERT INTO dbo.DELTA_STORE_DUMPING_GROUND (STR1_MAX)
SELECT TOP (251) REPLICATE(STR1, 40)
FROM dbo.STAGING_TABLE
ORDER BY ID
OPTION (MAXDOP 1);

Once again you can see the delta store:

a18_dmv_3

Things are different if we increase the length of the inserted data. The query below writes to a compressed rowgroup and bypasses the delta store:

TRUNCATE TABLE dbo.DELTA_STORE_DUMPING_GROUND;

INSERT INTO dbo.DELTA_STORE_DUMPING_GROUND (STR1_MAX)
SELECT TOP (251) REPLICATE(STR1, 500)
FROM dbo.STAGING_TABLE
ORDER BY ID
OPTION (MAXDOP 1);

The resulting rowgroup is compressed:

a18_dmv_4

Removing just a single row from the insert brings us back to the delta store.

Inserting to Multiple Partitions

If a MAXDOP 1 INSERT query writes to multiple partitions then it could possibly write to multiple delta stores. The number of rows written to each partition is important as opposed to the total number of rows written to the table. Below I define a simple table with 2 partitions:

CREATE PARTITION FUNCTION CLUNKY_SYNTAX_1
(BIGINT)
AS RANGE LEFT
FOR VALUES (
  0
, 2000000
); 

CREATE PARTITION SCHEME CLUNKY_SYNTAX_2
AS PARTITION CLUNKY_SYNTAX_1
ALL TO ( [PRIMARY] );

DROP TABLE IF EXISTS dbo.PARTITIONED_DELTA_STORE;
CREATE TABLE dbo.PARTITIONED_DELTA_STORE (
ID BIGINT NULL,
INDEX CCI CLUSTERED COLUMNSTORE
) ON CLUNKY_SYNTAX_2 (ID);

The insert writes 200k rows to the CCI which you might expect to bypass the delta store, but since the rows are evenly spread over two partitions we end up with two delta stores:

INSERT INTO dbo.PARTITIONED_DELTA_STORE (ID)
SELECT ID
FROM dbo.STAGING_TABLE
WHERE ID BETWEEN 1900001 AND 2100000
OPTION (MAXDOP 1);

a18_dmv_5

With MAXDOP 8 INSERT queries and the maximum number of partitions defined on a table, it is possible to get 120000 delta stores. I don’t recommend doing this.

Bulk Insert Leftovers

Often applications will not insert an exact multiple of 1048576 rows. That means that rows can be left over after a few rowgroups worth of inserted rows are compressed. Those leftover rows can go into a delta store. Consider the following insert query that inserts 100000 rows more than 1048576:

TRUNCATE TABLE dbo.DELTA_STORE_DUMPING_GROUND;

INSERT INTO dbo.DELTA_STORE_DUMPING_GROUND (ID)
SELECT TOP (1048576 + 100000) ID
FROM dbo.STAGING_TABLE
ORDER BY ID
OPTION (MAXDOP 1);

As expected, the final result is one compressed rowgroup of 1048576 rows and one delta store of 100k rows.

a18_dmv_6

If we inserted just a few thousand more rows than we’d end up with two compressed rowgroups.

Updates

UPDATE queries always write to the delta store. There are many other reasons to avoid UPDATES to CCIs if the application makes it possible to do so.

TRUNCATE TABLE dbo.DELTA_STORE_DUMPING_GROUND;

INSERT INTO dbo.DELTA_STORE_DUMPING_GROUND (ID)
SELECT TOP (1048576) ID
FROM dbo.STAGING_TABLE
ORDER BY ID
OPTION (MAXDOP 1);

At first there’s just a single compressed rowgroup:

a18_dmv_7

Now run the UPDATE query and go make coffee:

UPDATE DELTA_STORE_DUMPING_GROUND
SET ID = ID;

Our table doesn’t look so hot:

a18_dmv_8

In SQL Server 2016 the Tuple Mover will not clean up this table. Another row needs to be inserted into the table before the rowgroup is marked as CLOSED.

Parallel Insert

Many parallel queries have an element of randomess around how rows are distributed to parallel threads. Rows are not moved between threads after they flow to the part of the plan that performs the insert into the CCI. It’s possible to end up with a number of new delta stores equal to the number of parallel threads for the query. Let’s start with a parallel insert that moves 4 * 1048576 rows into the CCI:

TRUNCATE TABLE dbo.DELTA_STORE_DUMPING_GROUND;

INSERT INTO dbo.DELTA_STORE_DUMPING_GROUND
WITH (TABLOCK) (ID)
SELECT ID
FROM dbo.STAGING_TABLE
OPTION (MAXDOP 4);

It’s possible to end up without any delta stores and the results of the query against sys.dm_db_column_store_row_group_physical_stats will vary, but generally you’ll get at least one:

a18_dmv_9

If we have unnaturally high beauty standards for our rowgroups we can rewrite the query to effectively force rows to be evenly distributed on all threads. The query below does this with a join to a derived table:

TRUNCATE TABLE dbo.DELTA_STORE_DUMPING_GROUND;

INSERT INTO dbo.DELTA_STORE_DUMPING_GROUND
WITH (TABLOCK) (ID)
SELECT stg.ID
FROM
(
	VALUES
	(0 * 1048576 + 1, 1 * 1048576),
	(1 * 1048576 + 1, 2 * 1048576),
	(2 * 1048576 + 1, 3 * 1048576),
	(3 * 1048576 + 1, 4 * 1048576)
)
v (start_id, end_id)
INNER JOIN dbo.STAGING_TABLE stg ON
	stg.ID BETWEEN v.start_id and v.end_id
OPTION (MAXDOP 4);

Perfection:

a18_dmv_10

I know that you were looking forward to another image of a tiny table, but here’s the important part of the query plan for those who like that sort of thing:

a18_parallel_query_plan_1

Getting perfect rowgroups can also be accomplished by adding the TOP operator to the original query, but that adds a serial zone to the plan:

TRUNCATE TABLE dbo.DELTA_STORE_DUMPING_GROUND;

INSERT INTO dbo.DELTA_STORE_DUMPING_GROUND
WITH (TABLOCK) (ID)
SELECT TOP (9999999999999999) stg.ID
FROM dbo.STAGING_TABLE stg
OPTION (MAXDOP 4);

The key here is the parallelism operator in the plan uses a round robin method for distributing rows:

a18_parallel_query_plan_2

Dictionary Pressure

In SQL Server 2016 the maximum size for a column dictionary is 16 MB. This limit is raised in SQL Server 2017 for VARCHAR(MAX) and similar columns. I’m not going to get into the details of dictionaries here but it suffices to say that columns with too many unique string columns can experience dictionary pressure. Dictionary pressure leads to compressed rows that are less than the perfect size of 1048576 rows. Let’s insert the STR1 column into the CCI this time:

TRUNCATE TABLE dbo.DELTA_STORE_DUMPING_GROUND;

INSERT INTO dbo.DELTA_STORE_DUMPING_GROUND (STR1)
SELECT TOP (1048576) stg.STR1
FROM dbo.STAGING_TABLE stg
ORDER BY ID
OPTION (MAXDOP 1);

Due to dictionary pressure there’s now a delta store with about 73000 rows:

a18_dmv_11

We can see that the dictionary size for the column is close to the limit with the query below:

SELECT csd.entry_count, csd.on_disk_size
FROM sys.column_store_dictionaries csd
INNER JOIN sys.partitions p
    ON csd.partition_id = p.partition_id
INNER JOIN sys.tables t
    ON p.OBJECT_ID = t.OBJECT_ID
WHERE t.name = 'DELTA_STORE_DUMPING_GROUND'
AND csd.column_id = 2;

Here are the results:

a18_dict

Rowgroup Memory Pressure

The memory grant for CCI compression for an INSERT is calculated based on DOP and column definitions of target columns in the target table. The memory grant can be insufficient to get a full 1048576 rows into a compressed rowgroup depending on the table definition and the characteristics of the data getting loaded into the table. Consider an example in which data is loaded into three columns of the CCI:

TRUNCATE TABLE dbo.DELTA_STORE_DUMPING_GROUND;

INSERT INTO dbo.DELTA_STORE_DUMPING_GROUND
(STR1, STR2, STR3)
SELECT TOP (1048576)
  LEFT(STR1, 10)
, LEFT(STR1, 5)
, LEFT(STR1, 6)
FROM
dbo.STAGING_TABLE stg
ORDER BY ID
OPTION (MAXDOP 1);

With the above syntax the memory grant is calculated from just the STR1, STR2, and STR3 columns. The memory grant of 171152 KB isn’t enough to avoid a delta store:

a18_dmv_12

Note that you may not see the same results on your machine due to the randomness of the source data. For my table and source data set, adding a single column and inserting NULL into it bumps the memory grant up enough to avoid memory pressure:

TRUNCATE TABLE dbo.DELTA_STORE_DUMPING_GROUND;

ALTER TABLE dbo.DELTA_STORE_DUMPING_GROUND
ADD MORE_MEMORY_PLZ VARCHAR(1) NULL;

INSERT INTO dbo.DELTA_STORE_DUMPING_GROUND
(STR1, STR2, STR3, MORE_MEMORY_PLZ)
SELECT TOP (1048576)
  LEFT(STR1, 10)
, LEFT(STR1, 5)
, LEFT(STR1, 6)
, NULL
FROM
dbo.STAGING_TABLE stg
ORDER BY ID
OPTION (MAXDOP 1);

The compressed rowgroup contains 1048576 rows now that memory pressure has been addressed.

a18_dmv_13

Cardinality Estimate Less Than 251 Rows

SQL Server won’t even ask for a memory grant if the cardinality estimate is less than 251 rows. Perhaps this is because the memory grant would be wasted unless at least 102400 rows were inserted into the table. There’s no second chance at a memory grant here, so it’s possible to insert millions of rows to delta stores. A TOP expression with a variable will default to a cardinality estimate of 100 rows, so this works nicely to show the behavior:

TRUNCATE TABLE dbo.DELTA_STORE_DUMPING_GROUND;

DECLARE @top_rows BIGINT = 1048576;
INSERT INTO dbo.DELTA_STORE_DUMPING_GROUND (ID)
SELECT TOP (@top_rows) ID
FROM dbo.STAGING_TABLE
ORDER BY ID
OPTION (MAXDOP 1);

Despite inserting 1048576 rows we aren’t able to bypass the delta store:

a18_dmv_14

The same behavior can be observed with a cardinality estimate of 250 rows. The OPTIMIZE FOR query hint is used to control the estimate.

TRUNCATE TABLE dbo.DELTA_STORE_DUMPING_GROUND;

DECLARE @top_rows BIGINT = 1048576;
INSERT INTO dbo.DELTA_STORE_DUMPING_GROUND (ID)
SELECT TOP (@top_rows) ID
FROM dbo.STAGING_TABLE
ORDER BY ID
OPTION (MAXDOP 1, OPTIMIZE FOR (@top_rows = 250));

However, if I bump up the estimate by one more row a memory grant is given to the query and the delta store is bypassed:

TRUNCATE TABLE dbo.DELTA_STORE_DUMPING_GROUND;

DECLARE @top_rows BIGINT = 1048576;
INSERT INTO dbo.DELTA_STORE_DUMPING_GROUND (ID)
SELECT TOP (@top_rows) ID
FROM dbo.STAGING_TABLE
ORDER BY ID
OPTION (MAXDOP 1, OPTIMIZE FOR (@top_rows = 251));

a18_dmv_15

Under this scenario we’ve observed deadlocks when multiple sessions insert into delta stores from the same target table.

Extreme Server Memory Pressure

Memory grants for queries that insert into CCIs have a hardcoded timeout of 25 seconds. After 25 seconds they execute with required serial memory and always write to the delta store. In the query below I simulate memory pressure with a MAX_GRANT_PERCENT hint of 0:

TRUNCATE TABLE dbo.DELTA_STORE_DUMPING_GROUND;

INSERT INTO dbo.DELTA_STORE_DUMPING_GROUND (ID)
SELECT TOP (1048576) ID
FROM dbo.STAGING_TABLE
ORDER BY ID
OPTION (MAXDOP 1, MAX_GRANT_PERCENT = 0);

The query always writes to the delta store. It cannot compress data without a memory grant.

a18_dmv_15

Under this scenario we’ve observed deadlocks when multiple sessions insert into delta stores from the same target table.

Final Thoughts

It took forever to do the formatting for this one, so I hope that someone finds it useful.