A Row Goal Riddle

I’m the kind of guy who sometimes likes to look at execution plans with different hints applied to see how the plan shape and query operator costs change. Sometimes paying attention to operator costs can provide valuable clues as to why the query optimizer selected a plan that you didn’t like. Sometimes it doesn’t. My least favorite scenario is when I see inconsistent operator costs. This blog post covers a reproduction of such a case involving the dreaded and feared row goal.

The Data

For the data in my demo tables, I wanted a query of the following form:

SELECT *
FROM dbo.OUTER_HEAP o
WHERE NOT EXISTS
(
    SELECT 1
    FROM dbo.INNER_CI i
    WHERE i.ID = o.ID
);

that returned zero rows. However, I wanted the query optimizer to think that a decent number of rows would be returned. This was more difficult to do than expected. I could have just hacked stats to easily accomplish what I wanted, but did not do so out of stubbornness and pride. I eventually found a data set through trial and error with a final cardinality estimate of 16935.2 rows, or 1.7% of the rows in the outer table:

DROP TABLE IF EXISTS dbo.OUTER_HEAP;
CREATE TABLE dbo.OUTER_HEAP (
	ID VARCHAR(10)
);

INSERT INTO dbo.OUTER_HEAP WITH (TABLOCK)
SELECT TOP (1000000) 1500000
	+ ROW_NUMBER() OVER (ORDER BY (SELECT NULL))
FROM master..spt_values t1
CROSS JOIN master..spt_values t2
OPTION (MAXDOP 1);

CREATE STATISTICS S1 ON dbo.OUTER_HEAP (ID)
WITH FULLSCAN;

DROP TABLE IF EXISTS dbo.INNER_CI;
CREATE TABLE dbo.INNER_CI (
	ID VARCHAR(10),
	PRIMARY KEY (ID)
);

INSERT INTO dbo.INNER_CI WITH (TABLOCK)
SELECT TOP (2000000) 500000
	+ ROW_NUMBER() OVER (ORDER BY (SELECT NULL))
FROM master..spt_values t1
CROSS JOIN master..spt_values t2
OPTION (MAXDOP 1);

CREATE STATISTICS S1 ON dbo.INNER_CI (ID)
WITH FULLSCAN;

The actual query of interest is the following one:

SELECT TOP (1) 1
FROM dbo.OUTER_HEAP o
WHERE NOT EXISTS
(
    SELECT 1
    FROM dbo.INNER_CI i
    WHERE i.ID = o.ID
);

Such a query might be used as part of an ETL process as some kind of data validation step. The most interesting case to me is when the query returns no rows, but the query optimizer (for whatever reason) thinks otherwise.

Row Goal Problems

On my machine I get the following plan for the TOP (1) query:

a29_row_goal_nl


The plan has a total cost of 0.198516 optimizer units. If you know anything about row goals (this may be a good time for the reader to visit Paul White’s series on row goals) you might not be terribly surprised by the outcome. The row goal introduced by the TOP (1) makes the nested loop join very attractive in comparison to other plan choices. The cost of the scan on OUTER_HEAP is discounted from 2.93662 units to 0.0036173 units and the optimizer only expects to do 116 clustered index seeks against INNER_CI before it finds a row that does not match. However, we know our data and we know that all rows match. Therefore, the query will not return any rows and it must scan all rows in OUTER_HEAP if I execute the query. On my machine the query takes about two seconds:

CPU time = 1953 ms, elapsed time = 1963 ms.

If we’re going to read most of the rows anyway why not try a HASH JOIN hint? At least that plan won’t have a million clustered index seeks:

a29_HJ_PLAN

The new plan runs in MAXDOP 4 on my machine (although for not very long due to CPU cooling issues) and has a total cost of 19.9924 optimizer units. Query execution finishes in significantly less time:

CPU time = 1187 ms, elapsed time = 372 ms.

The Riddle

Can we do better than an ugly join hint? Microsoft blessed us with USE HINT functionality in SQL Server 2016 SP1, so let’s go ahead and try that to see if we can improve the performance of the query. To understand the full effect of the hint let’s get estimated plans for OPTION clauses of (USE HINT ('DISABLE_OPTIMIZER_ROWGOAL'), LOOP JOIN) and (USE HINT ('DISABLE_OPTIMIZER_ROWGOAL'), HASH JOIN). In theory, that will make it easy to compare the two queries:
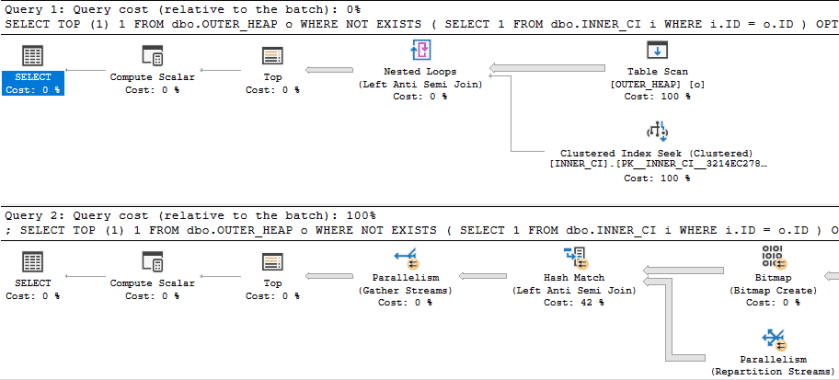
a29_compare_plans

Something looks very wrong here. The loop join plan has a significantly lower cost than the hash join plan! In fact, the loop join plan has a total cost of 0.0167621 optimizer units. Why would disabling row goals for such a plan cause a decrease in total query cost?

I uploaded the estimated plans here for those who wish to examine them without going through the trouble of creating tables.

Let’s Try Adding Trace Flags

First let’s try the query with just a USE HINT and no join hint. I get the hash join plan shape that I was after with a total cost of 19.9924 optimizer units. That’s definitely a good thing, but why did the optimizer pick that plan? The plan with a loop join is quite a bargain at 0.0167621 optimizer units. The optimization level is FULL, but that doesn’t mean that every possible plan choice was evaluated. Perhaps the answer is as simple as the optimizer did not consider a nested loop join plan while evaluating possible plan choices.

There are a few different ways to see which optimizer rules were considered during query plan compilation. We can add trace flags 3604 and 8619 at the query level to get information about the rules that were applied during optimization. All of these trace flags are undocumented, don’t use them in production, blah blah blah. For clarity, the query now looks like this:

SELECT TOP (1) 1
FROM dbo.OUTER_HEAP o
WHERE NOT EXISTS
(
    SELECT 1
    FROM dbo.INNER_CI i
    WHERE i.ID = o.ID
) OPTION (USE HINT ('DISABLE_OPTIMIZER_ROWGOAL')
, QUERYTRACEON 3604
, QUERYTRACEON 8619
);

Among other rules, we can see a few associated with nested loops:

Apply Rule: LeftSideJNtoIdxLookup - LOJN/LSJ/LASJ -> IDX LOOKUP
Apply Rule: LASJNtoNL - LASJN -> NL

So the optimizer did consider nested loop joins at some point but it went with the hash join plan instead. That’s interesting.

Let’s Try More Trace Flags

A logical next step is to try to get more operator costing information. Perhaps the cost of the nested loop join plan when considered during optimization is different from the value displayed in the query plan in SSMS. As the optimizer applies different rules and does different transformations the overall cost can change, so I suppose this isn’t a totally unreasonable theory. My first attempt at getting cost information for multiple plan options is by looking at the final memo for the query. This can be done with trace flag 8615.

For clarity, the query now looks like this:

SELECT TOP (1) 1
FROM dbo.OUTER_HEAP o
WHERE NOT EXISTS
(
    SELECT 1
    FROM dbo.INNER_CI i
    WHERE i.ID = o.ID
) OPTION (USE HINT ('DISABLE_OPTIMIZER_ROWGOAL')
, QUERYTRACEON 3604
, QUERYTRACEON 8615
-- , QUERYTRACEON 8619
);

Group 8 is the only one with any costing information for joins:

Group 8: Card=16935.2 (Max=1.1e+006, Min=0)
   11 PhyOp_HashJoinx_jtLeftAntiSemiJoin 6.9 7.10 5.0  Cost(RowGoal 0,ReW 0,ReB 0,Dist 0,Total 0)= 26.5569 (Distance = 1)
   4 PhyOp_HashJoinx_jtLeftAntiSemiJoin 6.4 7.3 5.0  Cost(RowGoal 0,ReW 0,ReB 0,Dist 0,Total 0)= 38.4812 (Distance = 1)
   1 LogOp_RightAntiSemiJoin 7 6 5 (Distance = 1)
   0 LogOp_LeftAntiSemiJoin 6 7 5 (Distance = 0)

This is rather disappointing. There’s only costing information for a few hash join plans. We know that other join types were considered. Perhaps they were discarded from the memo. The final memo just doesn’t have enough information to answer our question.

We Must Not Be Using Enough Trace Flags

There’s a trace flag that adds memo arguments to trace flag 8619: 8620. Perhaps that will give us additional clues. For clarity, the query now looks like this:

SELECT TOP (1) 1
FROM dbo.OUTER_HEAP o
WHERE NOT EXISTS
(
    SELECT 1
    FROM dbo.INNER_CI i
    WHERE i.ID = o.ID
) OPTION (USE HINT ('DISABLE_OPTIMIZER_ROWGOAL')
, QUERYTRACEON 3604
, QUERYTRACEON 8615
, QUERYTRACEON 8619
, QUERYTRACEON 8620
);

The output is again disappointing. I’ll skip covering it and jump to trace flag 8621. That one adds additional information about the rules and how they interact with memos. With this trace flag we find more information about the plans with merge or loop joins:

Rule Result: group=8 1 LogOp_RightAntiSemiJoin 7 6 5 (Distance = 1)
Rule Result: group=8 2 PhyOp_MergeJoin 1-M x_jtRightAntiSemiJoin 7 6 5 (Distance = 2)
Rule Result: group=8 3 PhyOp_HashJoinx_jtRightAntiSemiJoin 7 6 5 (Distance = 2)
Rule Result: group=8 4 PhyOp_HashJoinx_jtLeftAntiSemiJoin 6 7 5 (Distance = 1)
Rule Result: group=8 5 PhyOp_Applyx_jtLeftAntiSemiJoin 6 16 (Distance = 1)
Rule Result: group=8 6 PhyOp_Applyx_jtLeftAntiSemiJoin 6 16 (Distance = 1)
Rule Result: group=8 7 PhyOp_LoopsJoinx_jtLeftAntiSemiJoin 6 17 5 (Distance = 1)
Rule Result: group=8 8 PhyOp_LoopsJoinx_jtLeftAntiSemiJoin 6 7 5 (Distance = 1)
Rule Result: group=8 9 PhyOp_MergeJoin 1-M x_jtRightAntiSemiJoin 7 6 5 (Distance = 2)
Rule Result: group=8 10 PhyOp_HashJoinx_jtRightAntiSemiJoin 7 6 5 (Distance = 2)
Rule Result: group=8 11 PhyOp_HashJoinx_jtLeftAntiSemiJoin 6 7 5 (Distance = 1)
Rule Result: group=8 12 PhyOp_Applyx_jtLeftAntiSemiJoin 6 16 (Distance = 1)
Rule Result: group=8 13 PhyOp_Applyx_jtLeftAntiSemiJoin 6 16 (Distance = 1)
Rule Result: group=8 14 PhyOp_LoopsJoinx_jtLeftAntiSemiJoin 6 17 5 (Distance = 1)
Rule Result: group=8 15 PhyOp_LoopsJoinx_jtLeftAntiSemiJoin 6 17 5 (Distance = 1)
Rule Result: group=8 16 PhyOp_LoopsJoinx_jtLeftAntiSemiJoin 6 7 5 (Distance = 1)
Rule Result: group=8 17 PhyOp_LoopsJoinx_jtLeftAntiSemiJoin 6 7 5 (Distance = 1)

However, group 8 in the final memo still looks the same as before:

Group 8: Card=16935.2 (Max=1.1e+006, Min=0)
   11 PhyOp_HashJoinx_jtLeftAntiSemiJoin 6.9 7.10 5.0  Cost(RowGoal 0,ReW 0,ReB 0,Dist 0,Total 0)= 26.5569 (Distance = 1)
   4 PhyOp_HashJoinx_jtLeftAntiSemiJoin 6.4 7.3 5.0  Cost(RowGoal 0,ReW 0,ReB 0,Dist 0,Total 0)= 38.4812 (Distance = 1)
   1 LogOp_RightAntiSemiJoin 7 6 5 (Distance = 1)
   0 LogOp_LeftAntiSemiJoin 6 7 5 (Distance = 0)

My interpretation is that costing information for the other join types was discarded from the memo. For example, at one point there was an item 5 in group 8 which contained information relevant to costing for one of the nested loop join plans. All of that information is not present in the final plan because the hash join plan was cheaper.

Pray to the Trace Flag Gods

There is an undisclosed trace flag which does not allow items to be discarded from the memo. Obviously this is a dangerous thing to do. However, with that trace flag group 8 finally reveals all of its secrets:

Group 8: Card=16935.2 (Max=1.1e+006, Min=0)
   17 PhyOp_LoopsJoinx_jtLeftAntiSemiJoin 6 7 5.0 (Distance = 1)
   16 PhyOp_LoopsJoinx_jtLeftAntiSemiJoin 6 7 5.0 (Distance = 1)
   15 PhyOp_LoopsJoinx_jtLeftAntiSemiJoin 6 17 5.0 (Distance = 1)
   14 PhyOp_LoopsJoinx_jtLeftAntiSemiJoin 6 17 5.0 (Distance = 1)
   13 PhyOp_Applyx_jtLeftAntiSemiJoin 6 16 (Distance = 1)
   12 PhyOp_Applyx_jtLeftAntiSemiJoin 6 16 (Distance = 1)
   11 PhyOp_HashJoinx_jtLeftAntiSemiJoin 6.9 7.10 5.0  Cost(RowGoal 0,ReW 0,ReB 0,Dist 0,Total 0)= 26.5569 (Distance = 1)
   10 PhyOp_HashJoinx_jtRightAntiSemiJoin 7.8 6 5 (Distance = 2)
   9 PhyOp_MergeJoin 1-M x_jtRightAntiSemiJoin 7.6 6 5 (Distance = 2)
   8 PhyOp_LoopsJoinx_jtLeftAntiSemiJoin 6 7 5.0 (Distance = 1)
   7 PhyOp_LoopsJoinx_jtLeftAntiSemiJoin 6 17 5.0 (Distance = 1)
   6 PhyOp_Applyx_jtLeftAntiSemiJoin 6 16 (Distance = 1)
   5 PhyOp_Applyx_jtLeftAntiSemiJoin 6 16 (Distance = 1)
   4 PhyOp_HashJoinx_jtLeftAntiSemiJoin 6.4 7.3 5.0  Cost(RowGoal 0,ReW 0,ReB 0,Dist 0,Total 0)= 38.4812 (Distance = 1)
   3 PhyOp_HashJoinx_jtRightAntiSemiJoin 7.3 6.4 5.0  Cost(RowGoal 0,ReW 0,ReB 0,Dist 0,Total 0)= 48.5597 (Distance = 2)
   2 PhyOp_MergeJoin 1-M x_jtRightAntiSemiJoin 7.1 6.2 5.0  Cost(RowGoal 0,ReW 0,ReB 0,Dist 0,Total 0)= 106.564 (Distance = 2)
   1 LogOp_RightAntiSemiJoin 7 6 5 (Distance = 1)
   0 LogOp_LeftAntiSemiJoin 6 7 5 (Distance = 0)

Let’s consider item 5 because it’s one of the more reasonable loop join plan options. Item 5 doesn’t give us direct costing information but it directs us to look to group 16:

Group 16: Card=1 (Max=1, Min=0)
   2 PhyOp_Range 1 ASC  5.0  Cost(RowGoal 0,ReW 0,ReB 999999,Dist 1e+006,Total 1e+006)= 165.607 (Distance = 2)
   1 PhyOp_Range 1 ASC  5.0  Cost(RowGoal 0,ReW 0,ReB 999999,Dist 1e+006,Total 1e+006 s)= 165.607 (Distance = 2)
   0 LogOp_SelectIdx 15 5 (Distance = 1)

We can see a cost of 165.607 for the clustered index seeks on the inner side of the join. If that was the cost used when comparing plans then it explains why the optimizer opted for a hash join over the loop join. We might try looking at a query plan for the following:

DECLARE @TOP INT = 1;

SELECT TOP (@TOP) 1
FROM dbo.OUTER_HEAP o
WHERE NOT EXISTS
(
    SELECT 1
    FROM dbo.INNER_CI i
    WHERE i.ID = o.ID
)
OPTION (OPTIMIZE FOR (@TOP = 987654321)
, LOOP JOIN
, MAXDOP 1);

With the above syntax we will get the same query results as before but the effective TOP (1) cannot change the cost of the query. Here are the operator details for the clustered index seek on INNER_CI:
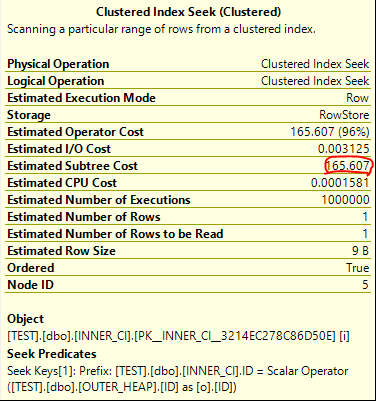
a29_seek_costs

It’s an exact match. The total cost of the query is 172.727 optimizer units, which is significantly more than the price tag of 19.9924 units for the hash join plan.

Improving Displayed Costing

So is there really a problem with the displayed cost of the plan with hints matching (USE HINT ('DISABLE_OPTIMIZER_ROWGOAL'), LOOP JOIN)? After all, the USE HINT seemed to give the correct plan shape without the join hints. Let’s compare the TOP plan side by side with it:

a29_compare_nl_plans

I also uploaded the estimated plans here.

In my view, the costs of the USE HINT plan are nonsensical. The scan and the seeks have matching operator costs of 0.0167621 units. Bizarrely, this also matches the final query cost. 0.0167621 + 0.0167621 = 0.0167621. It’s totally unclear where these numbers come from, and if a TOP (1) can aggressively discount all of the operators in a plan then it seems like the DISABLE_OPTIMIZER_ROWGOAL hint will not have its intended practical impact. Certainly a TOP (1) will not discount the costs of blocking operators, so plans without them (such as loop joins) will be costed cheaper than plans with them (like hash joins).

I would prefer to see matching query costs for both subtrees. Of course, the TOP (1) can influence the costs of other parts of the plan that depend on this subtree, so the estimate needs to obey the TOP expression. I just feel that it shouldn’t affect the cost of the immediate subtree.

If you’re curious where the 0.016762 number comes from, I suspect that it has something to do with the TOP (1) capping the cost of the nested loop join. The following can be found in the final memo:

Group 11: Card=1 (Max=1, Min=0)
   1 PhyOp_Top 8.2 9.0 10.0  Cost(RowGoal 0,ReW 0,ReB 0,Dist 0,Total 0)= 0.016762 (Distance = 1)

Group 8: Card=16935.2 (Max=1.1e+006, Min=0)
   2 PhyOp_Applyx_jtLeftAntiSemiJoin 6.4 15.2  Cost(RowGoal 0,ReW 0,ReB 0,Dist 0,Total 0)= 172.723 (Distance = 1)

In addition, the query cost slightly increases when I change the query to return the first 2 rows. You could argue that query plan costs are just numbers and there’s no reason to care about them as long as you get the right plan, but that’s not quite true. I’m sure this isn’t an exhaustive list, but query plan costs can affect at least the following:

  • If the query cost is too low it won’t be eligible for a parallel plan.
  • The number of seconds that a query will wait for a memory grant before throwing an error.
  • The amount of steps taken by the optimizer during query plan creation.
  • If the query is sent to a small query resource semaphore.
  • If the query is not able to run due to the query governor cost limit.

Final Thoughts

Congrats if you made it to the end. Thanks for reading!

Advertisement

The Return of RESERVED_MEMORY_ALLOCATION_EXT

It is possible to see a scalability bottleneck in the form of high average wait time for the RESERVED_MEMORY_ALLOCATION_EXT wait if a highly concurrent workload is run on a server that consumes memory with batch mode operators. I believe that the severity of the bottleneck depends on unknown factors in the server’s initial memory state and the rate of memory actually used by queries to run batch mode operations. This blog post shares a reproduction of the issue along with a call to action.

The Test Query

Data prep for the test query is very simple. We throw the first ten million sequential integers into two single column BIGINT tables. Additionally, an empty CCI is created to add eligibility for batch mode as desired:

DROP TABLE IF EXISTS DUMMY_CCI;
CREATE TABLE DUMMY_CCI (
	ID INT,
	INDEX CCI CLUSTERED COLUMNSTORE
);

DROP TABLE IF EXISTS HASH_JOIN_SCALE_TEST_1;
CREATE TABLE HASH_JOIN_SCALE_TEST_1 (
	ID BIGINT NOT NULL
);

INSERT INTO HASH_JOIN_SCALE_TEST_1 WITH (TABLOCK)
SELECT TOP (10000000) ROW_NUMBER()
	OVER (ORDER BY (SELECT NULL))
FROM master..spt_values t1
CROSS JOIN master..spt_values t2
CROSS JOIN master..spt_values t3
OPTION (MAXDOP 1);

DROP TABLE IF EXISTS HASH_JOIN_SCALE_TEST_2;
CREATE TABLE HASH_JOIN_SCALE_TEST_2 (
ID BIGINT NOT NULL
);

INSERT INTO HASH_JOIN_SCALE_TEST_2 WITH (TABLOCK)
SELECT TOP (10000000) ROW_NUMBER()
	OVER (ORDER BY (SELECT NULL))
FROM master..spt_values t1
CROSS JOIN master..spt_values t2
CROSS JOIN master..spt_values t3
OPTION (MAXDOP 1);

The SELECT query that we’re going to test with joins them together and returns a count of distinct IDs:

SELECT COUNT(DISTINCT t1.ID)
FROM dbo.HASH_JOIN_SCALE_TEST_1 t1
LEFT OUTER JOIN dbo.HASH_JOIN_SCALE_TEST_2 t2
	ON t1.ID = t2.ID
OPTION (MAXDOP 1);

This is certainly an odd thing to do, but the point of this query is to create a simple test case that uses a bit of memory to create hash tables. Without any indexes on the table we’re very likely to get a hash join. In row mode the query takes about 17 seconds on the test server and uses 1257528 KB of memory.

As far as I can tell this query is a good fit for batch mode. The join is on BIGINT columns and everything except for the rowstore scans can execute in batch mode:

a28_query_plan

Even with the hidden conversions of 20 million rows from row mode to batch mode the query finishes in about 5 seconds. It uses significantly less memory compared to the row mode query: 386112 KB. All of this seems very reasonable.

Testing at Scale

The situation becomes less reasonable once there are many concurrent queries running at once. We go from the batch mode query running in a third of the time of row mode to sometimes running slower. Testing was done with 96 concurrent queries each running queries until 576 total queries were completed. Below is a graph of OS CPU and OS privileged time CPU based on perfmon data:

a28_cpu_graphs

The first third of the graph corresponds to the batch mode workload. CPU never hits 100% and is extremely variable during the run. We also see a high amount of privileged time in the OS. Within SQL Server, we use a total of 222,400,512 KB of query memory. The total wait time for RESERVED_MEMORY_ALLOCATION_EXT can vary, but for this one it was around 11.5 million ms.

The second third of the graph is the part that resets the server memory state. As stated in the introduction, this scalability bottleneck doesn’t always happen and seems to have some kind of dependency on the server’s initial memory state. Here we do a SELECT COUNT(*) on a 1 TB table to add pressure to the rowstore buffer pool.

The final third of the graph corresponds to the row mode workload. CPU jumps to near 100% very quickly and doesn’t waver much during the run. There is very little privileged time in the OS. Within SQL Server, we use a total of 724,336,128 KB of query memory. The wait time for RESERVED_MEMORY_ALLOCATION_EXT is always significantly reduced compared to batch mode. For this run it was around 107k ms.

In conclusion, we see about 1% of memory wait time with the row mode workload compared to the batch mode workload. Usually the row mode workload finishes a little faster than the batch mode one, despite needing over 3X as much total memory and the per-query efficiency advantage of batch mode.

Speculation on the Problem

There may be a hint in the memory management architecture guide:

Starting with SQL Server 2012, SQL Server might allocate more memory than the value specified in the max server memory setting. This behavior may occur when the Total Server Memory (KB) value has already reached the Target Server Memory (KB) setting (as specified by max server memory). If there is insufficient contiguous free memory to meet the demand of multi-page memory requests (more than 8 KB) because of memory fragmentation, SQL Server can perform over-commitment instead of rejecting the memory request.

This behavior is typically observed during the following operations: Large Columnstore index queries.

There are observable differences in how memory is allocated for the same operator when switching from batch mode to row mode. The number of wait events for RESERVED_MEMORY_ALLOCATION_EXT is significantly higher for row mode compared to batch mode. In addition, it remains nearly constant when TF 834 is enabled:

a28_memory_waits

TF 834 appears to fully resolve the scalability issue with batch mode, just like last time. It offers a dramatic improvement in workload completion time:

a28_summary_of_timings

Perhaps some batch mode operators require contiguous free memory for their allocations but the same operation done through row mode does not have that restriction. I can’t go any further than this because I don’t know anything about OS internals or memory management, but it could explain why we see such different behavior between row mode and batch mode.

Use Your Voice

Since SQL Server 2012, Microsoft has listed TF 834 as incompatible with columnstore. There are lots of scary consequences:

  • A non-yielding scheduler error and associated memory dumps in the SQL Server Error log.
  • Columnstore queries trigger severe performance issues.
  • A SQL Server instance triggers access violations when you execute Columnstore queries.
  • You encounter the following error when you run sp_createstats

However, I’ve been told that many of the SQL Server columnstore benchmarks for the TPC-H benchmarks use TF 834. It seems to be a natural fit for columnstore, and there are some workloads (seen in the lab and reproduced in the last two blog posts) where it resolves a key scalability bottleneck which is difficult to address through other means. I have created a feedback item on UserVoice requesting that Microsoft support TF 834 with columnstore.

Final Thoughts

Please provide feedback on the UserVoice item if you are able to do so. Thanks for reading!

Large CCI ETLs Cannot Scale Without TF 834

Large servers may experience a scalability bottleneck related to the RESERVED_MEMORY_ALLOCATION_EXT wait event during loading of columnstore tables. This blog post shares a reproduction of the issue and discusses some test results.

The Test Server

Testing was done on a four socket bare metal server with 24 cores per socket. The server had 1 TB of RAM and storage was provided by a SAN. Within SQL Server, we were able to read data at a peak rate of about 5.5 GB/s. Hyperthreading was disabled, but there aren’t any other nonstandard OS configuration settings that I’m aware of.

SQL Server 2016 SP1 CU7 was installed on Windows Server 2016. Most default settings were retained for this testing, including allowing auto soft-NUMA to break up the 96 schedulers into 12 groups of 8, with 3 per memory node. Max server memory was set to around 800000 MB. The user database had 24 data files, indirect checkpoints weren’t used, and the memory model in use was conventional. No interesting trace flags were enabled, except perhaps for TF 4199. I did grow max server memory to close to the maximum before starting any of the tests.

Testing Code and Method

The workload test loaded the same data from a SQL Server table into 576 CCI target tables. For my testing I used a source table of one million rows. Each session grabs a number from a sequence, loads data into the table corresponding to the sequence number, and continues to do that until there are no more tables to process. This may seem like an odd test to run, but think of it as an abstract representation of a columnstore ETL workload which loads data into partitioned CCIs.

The first step is to define the source table. I created a 50 column table that stored only 0s in all of its rows. There’s nothing particularly special about this choice other that it has a very low disk footprint as a CCI because it compresses so well. On a non-busy system it took around 7.3 seconds to insert one million rows into a CCI. Below is the table definition:

DROP TABLE IF EXISTS CCI_SOURCE;

CREATE TABLE CCI_SOURCE (
ID1 SMALLINT,
ID2 SMALLINT,
ID3 SMALLINT,
ID4 SMALLINT,
ID5 SMALLINT,
ID6 SMALLINT,
ID7 SMALLINT,
ID8 SMALLINT,
ID9 SMALLINT,
ID10 SMALLINT,
ID11 SMALLINT,
ID12 SMALLINT,
ID13 SMALLINT,
ID14 SMALLINT,
ID15 SMALLINT,
ID16 SMALLINT,
ID17 SMALLINT,
ID18 SMALLINT,
ID19 SMALLINT,
ID20 SMALLINT,
ID21 SMALLINT,
ID22 SMALLINT,
ID23 SMALLINT,
ID24 SMALLINT,
ID25 SMALLINT,
ID26 SMALLINT,
ID27 SMALLINT,
ID28 SMALLINT,
ID29 SMALLINT,
ID30 SMALLINT,
ID31 SMALLINT,
ID32 SMALLINT,
ID33 SMALLINT,
ID34 SMALLINT,
ID35 SMALLINT,
ID36 SMALLINT,
ID37 SMALLINT,
ID38 SMALLINT,
ID39 SMALLINT,
ID40 SMALLINT,
ID41 SMALLINT,
ID42 SMALLINT,
ID43 SMALLINT,
ID44 SMALLINT,
ID45 SMALLINT,
ID46 SMALLINT,
ID47 SMALLINT,
ID48 SMALLINT,
ID49 SMALLINT,
ID50 SMALLINT
);

INSERT INTO CCI_SOURCE WITH (TABLOCK)
SELECT
 ID,ID,ID,ID,ID,ID,ID,ID,ID,ID
,ID,ID,ID,ID,ID,ID,ID,ID,ID,ID
FROM (
	SELECT TOP (1000000) 0 ID
	FROM master..spt_values t1
	CROSS JOIN master..spt_values t2
) t;

Next we need a stored procedure that can save off previous test results (as desired) and reset the server for the next test. If a test name is passed in then results are saved to CCI_TEST_RESULTS and CCI_TEST_WAIT_STATS from the previous run. The procedure always recreates all of the target CCI tables, resets the sequence, clears the buffer pool, and does a few other things.

CREATE OR ALTER PROCEDURE [dbo].[CCI_TEST_RESET] (@PreviousTestName NVARCHAR(100) = NULL, @DebugMe INT = 0)
AS
BEGIN
	DECLARE
	@tablename SYSNAME,
	@table_number INT = 1,
	@SQLToExecute NVARCHAR(4000);

	/*
CREATE TABLE CCI_TEST_WAIT_STATS (
	TEST_NAME NVARCHAR(100),
	WAIT_TYPE NVARCHAR(60),
	WAITING_TASKS_COUNT BIGINT,
	WAIT_TIME_MS BIGINT,
	MAX_WAIT_TIME_MS BIGINT,
	SIGNAL_WAIT_TIME_MS BIGINT
);

CREATE TABLE CCI_TEST_RESULTS (
	TEST_NAME NVARCHAR(100),
	TOTAL_SESSION_COUNT SMALLINT,
	TEST_DURATION INT,
	TOTAL_WORK_TIME INT,
	BEST_TABLE_TIME INT,
	WORST_TABLE_TIME INT,
	TOTAL_TABLES_PROCESSED SMALLINT,
	MIN_TABLES_PROCESSED SMALLINT,
	MAX_TABLES_PROCESSED SMALLINT
);
	*/

	SET NOCOUNT ON;

	IF @DebugMe = 0
	BEGIN
		DROP SEQUENCE IF EXISTS CCI_PARALLEL_TEST_SEQ;
		CREATE SEQUENCE CCI_PARALLEL_TEST_SEQ
			AS SMALLINT
			START WITH 1
			INCREMENT BY 1
			CACHE 600;

		IF @PreviousTestName  N''
		BEGIN
			INSERT INTO CCI_TEST_RESULTS WITH (TABLOCK)
			SELECT @PreviousTestName,
			  COUNT(*) TOTAL_SESSION_COUNT
			, DATEDIFF(MILLISECOND, MIN(MIN_START_TIME), MAX(MAX_END_TIME)) TEST_DURATION
			, SUM(TOTAL_SESSION_TIME) TOTAL_WORK_TIME
			, MIN(MIN_TABLE_TIME) BEST_TABLE_TIME
			, MAX(MAX_TABLE_TABLE) WORST_TABLE_TIME
			, SUM(CNT) TOTAL_TABLES_PROCESSED
			, MIN(CNT) MIN_TABLES_PROCESSED
			, MAX(CNT) MAX_TABLES_PROCESSED
			FROM (
				SELECT
				  SESSION_ID
				, COUNT(*) CNT
				, SUM(DATEDIFF(MILLISECOND, START_TIME, END_TIME)) TOTAL_SESSION_TIME
				, MIN(DATEDIFF(MILLISECOND, START_TIME, END_TIME)) MIN_TABLE_TIME
				, MAX(DATEDIFF(MILLISECOND, START_TIME, END_TIME)) MAX_TABLE_TABLE
				, MIN(START_TIME) MIN_START_TIME
				, MAX(END_TIME) MAX_END_TIME
				FROM CCI_TEST_LOGGING_TABLE
				GROUP BY SESSION_ID
			) t;

			INSERT INTO CCI_TEST_WAIT_STATS WITH (TABLOCK)
			SELECT @PreviousTestName, * FROM sys.dm_os_wait_stats
			WHERE wait_type IN (
				'RESERVED_MEMORY_ALLOCATION_EXT'
				, 'SOS_SCHEDULER_YIELD'
				, 'PAGEIOLATCH_EX'
				, 'MEMORY_ALLOCATION_EXT'
				, 'PAGELATCH_UP'
				, 'PAGEIOLATCH_SH'
				, 'WRITELOG'
				, 'LATCH_EX'
				, 'PAGELATCH_EX'
				, 'PAGELATCH_SH'
				, 'CMEMTHREAD'
				, 'LATCH_SH'
			);

		END;

		DROP TABLE IF EXISTS CCI_TEST_LOGGING_TABLE;
		CREATE TABLE CCI_TEST_LOGGING_TABLE (
			SESSION_ID INT,
			TABLE_NUMBER INT,
			START_TIME DATETIME,
			END_TIME DATETIME
		);

	END;

	WHILE @table_number BETWEEN 0 AND 576
	BEGIN
		SET @tablename = N'CCI_PARALLEL_RPT_TARGET_' + CAST(@table_number AS NVARCHAR(3));
		SET @SQLToExecute= N'DROP TABLE IF EXISTS ' + QUOTENAME(@tablename);
		IF @DebugMe = 1
		BEGIN
			PRINT @SQLToExecute;
		END
		ELSE
		BEGIN
			EXEC (@SQLToExecute);
		END;

		SET @SQLToExecute = N'SELECT * INTO ' + QUOTENAME(@tablename) +
		' FROM CCI_SOURCE WHERE 1 = 0';
		IF @DebugMe = 1
		BEGIN
			PRINT @SQLToExecute;
		END
		ELSE
		BEGIN
			EXEC (@SQLToExecute);
		END;

		SET @SQLToExecute = N'CREATE CLUSTERED COLUMNSTORE INDEX CCI ON ' + QUOTENAME(@tablename);
		IF @DebugMe = 1
		BEGIN
			PRINT @SQLToExecute;
		END
		ELSE
		BEGIN
			EXEC (@SQLToExecute);
		END;

		SET @table_number = @table_number + 1;
	END;

	IF @DebugMe = 0
	BEGIN
		DBCC DROPCLEANBUFFERS WITH NO_INFOMSGS;
		DBCC FREEPROCCACHE WITH NO_INFOMSGS;
		DBCC FREESYSTEMCACHE('ALL');

		SELECT COUNT(*) FROM CCI_SOURCE; -- read into cache

		DBCC SQLPERF ("sys.dm_os_wait_stats", CLEAR) WITH NO_INFOMSGS;
		DBCC SQLPERF ("sys.dm_os_spinlock_stats", CLEAR) WITH NO_INFOMSGS;
	END;
END;

Finally we need a stored procedure that can be called to do as many CCI inserts as it can as quickly as possible. I used the following code:

CREATE OR ALTER PROCEDURE [dbo].[CCI_RUN_INSERTS] (@DebugMe INT = 0)
AS
BEGIN
	DECLARE @table_number INT,
	@tablename SYSNAME,
	@SQLToExecute NVARCHAR(4000),
	@start_loop_time DATETIME;

	SET NOCOUNT ON;

	SELECT @table_number = NEXT VALUE FOR CCI_PARALLEL_TEST_SEQ;

	WHILE @table_number BETWEEN 0 AND 576
	BEGIN
		SET @start_loop_time = GETDATE();

		SET @tablename = N'CCI_PARALLEL_RPT_TARGET_' + CAST(@table_number AS NVARCHAR(3));
		SET @SQLToExecute= N'
		INSERT INTO ' + QUOTENAME(@tablename) + N' WITH (TABLOCK)
		SELECT * FROM CCI_SOURCE WITH (TABLOCK)
		OPTION (MAXDOP 1)';

		IF @DebugMe = 1
		BEGIN
			PRINT @SQLToExecute;
		END
		ELSE
		BEGIN
			EXEC (@SQLToExecute);

			INSERT INTO CCI_TEST_LOGGING_TABLE VALUES (@@SPID, @table_number, @start_loop_time, GETDATE());
		END;

		SELECT @table_number = NEXT VALUE FOR CCI_PARALLEL_TEST_SEQ;
	END;
END;

To vary the number of concurrent queries I used sqlcmd. Each set of 12 sessions had the following format:

START /B sqlcmd -d your_db_name -S your_server_name -Q "EXEC dbo.[CCI_RUN_INSERTS]" > nul
ping 192.2.0.1 -n 1 -w 1 > nul

My workflow was to perform this test was to add the desired number of calls to the stored procedure in the .bat file, run the test, and to check the results to make sure that the test was a good one. If it was I saved off results using the reset procedure. If not I ran the reset procedure and tried again.

The ping command is there to add a small delay between sets of queries. I found that adding such a delay led to less doubling up on schedulers. I picked 12 because that’s the number of soft-NUMA nodes. Sometimes tests would get quite a bit of SOS_SCHEDULER_YIELD waits which would mean that they couldn’t be accurately compared to other tests. My fix was to just run the test again. It required a bit of patience but I never had to run a test more than once. SOS waits weren’t eliminated but I’d say they fell to acceptable levels:

a27_SOS_CPU_wait_table

The right way to avoid SOS waits for testing like this (which might require every user session to go on its own scheduler) would be to set up 96 manual soft-NUMA nodes. But who has time for that?

Test Results

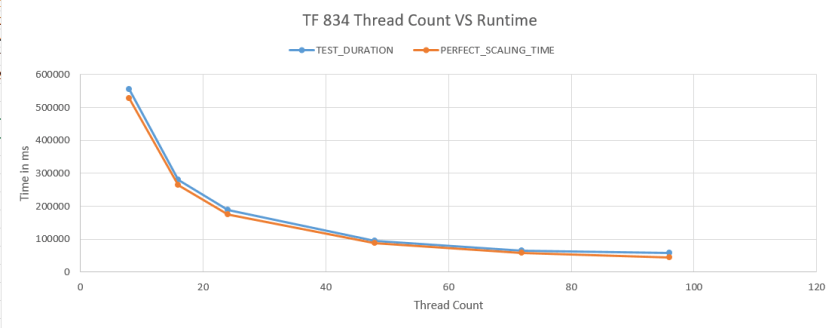
12 tests with different numbers of active queries were run. I picked numbers that somewhat evenly divided into 576 to try to keep work balanced between threads. The blue line in the chart below measures how long each test took from start to finish and the orange line represents how fast the test could have completed if there was no contention on the server whatsoever:

a27_No_T834_compare_chart

Naturally we can’t expect the two lines to match perfectly, but improvements in runtime stop after going past 32 threads. In fact, the workload takes longer with 96 threads compared to 32 threads.

The dominant wait event for the higher thread count runs is RESERVED_MEMORY_ALLOCATION_EXT. Below is a chart of all of the wait events worth mentioning for the 96 thread run:

a27_no_T834_wait_table

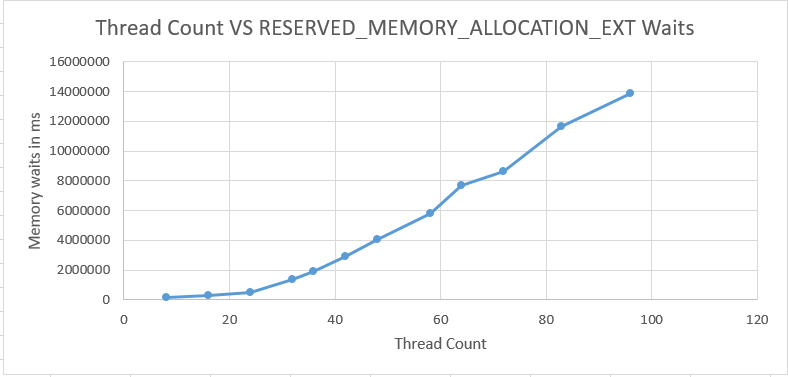
The total number of wait events for RESERVED_MEMORY_ALLOCATION_EXT is very consistent between runs. However, the average wait time significantly increases as the number of concurrent queries increases:

a27_memory_waits_chart

In fact, it could be said that that nearly all worker time past 32 threads is spent waiting on memory. The final column in the chart below is the total time spent in SQL Server minus wait time for RESERVED_MEMORY_ALLOCATION_EXT. The values in that column are remarkably consistent.

a27_No_TF_834_summary

In my experience, when we get into a situation with high memory waits caused by too much concurrent CCI activity all queries on the server that use a memory grant can be affected. For example, I’ve seen sp_whoisactive run for longer than 90 seconds.

It needs to be stated that not all CCIs will suffer from this scalability problem. I was able to achieve good scalability with some artificial tables, but all of the real target tables that I tested have excessive memory waits at high concurrency. Perhaps tables which require more CPU to compress naturally spread out their memory requests and the underlying OS is better able to keep up.

Test Results With Trace Flag 834

Microsoft strongly recommends against using trace flag 834 with columnstore tables. There’s even an article dedicated to that warning. I was desperate so I tried it anyway. The difference was night and day:

a27_T834_compare_chart

Enabling trace flag 834 does at least three things: SQL Server grows to max server memory on startup, AWE memory is used for memory access, and large pages are used for the buffer pool. I didn’t see gains when using LPIM (which uses AWE memory) or by growing memory to max before running tests with a conventional memory model, so I suspect that the large pages are making a key difference. Wait time for RESERVED_MEMORY_ALLOCATION_EXT is under a second for all tests.

Scalability is diminished a bit for the 96 thread run. There are some wait events that creep up:

TF_834_96_thread_wait_stats

All of the wait events can be troubleshooted in conventional ways except possibly for CMEMTHREAD. There’s no longer a large amount of time spent outside of SQL Server in the OS.

Other Workarounds

Without trace flag 834 this can be a difficult problem to work around. The two main strategies are to spread out CCI insert activity as much as possible during the ETL and to reduce memory usage of queries which run at the same time as the CCI inserts. For example, consider a query that inserts into a CCI that also performs a large hash join. If that hash join can be moved to somewhere else in the process then you might come out ahead in reducing contention on memory.

Other than that, there’s some evidence that virtualized servers are not a good fit for this type of workload. Large virtual guests experience the memory waits at an increased rate, but it isn’t yet clear if the problem can be avoided through some change in VM configuration.

Final Thoughts

It’s hard not to conclude that TF 834 is necessary to get scalability for columnstore ETLs on very large servers. Hopefully Microsoft will make TF 834 compatible with columnstore one day in the future. Thanks for reading!