ROWGROUP_FLUSH Deadlocks

We recently observed many ROWGROUP_FLUSH deadlocks while doing concurrent inserts into CCIs. I’m not really a concurrency kind of guy but I figured that I should blog about this just so other people with the same problem can find some information about it.

Deadlock Reproduction

The schedulers of the involved sessions are important in some way, especially when going for a simple reproduction. It’s easiest to just make all new sessions go the same CPU:

ALTER SERVER CONFIGURATION
SET PROCESS AFFINITY CPU = 0;

Obviously you should never do that in production. After affinity has been addressed I recommend creating a nearly empty source table and a new CCI table:

DROP TABLE IF EXISTS dbo.CCI_DEADLOCKED;
CREATE TABLE dbo.CCI_DEADLOCKED (
	COL VARCHAR(1500),
	INDEX CCI CLUSTERED COLUMNSTORE
);

CREATE TABLE ##SOURCE_IDS (ID BIGINT NOT NULL);

INSERT INTO ##SOURCE_IDS WITH (TABLOCK)
SELECT TOP (1048576) ROW_NUMBER()
	OVER (ORDER BY (SELECT NULL))
FROM master..spt_values t1
CROSS JOIN master..spt_values t2
OPTION (MAXDOP 1);

One way to see the deadlock is to quickly kick off two inserts into the CCI_DEADLOCKED table from different sessions. Inserting a larger amount of data means that you’ll have more time to kick off the second session before the first completes, but a longer rollback time on the first session. On my machine inserting 1048576 rows of VARCHAR(1500) data seems like a reasonable compromise:

INSERT INTO dbo.CCI_DEADLOCKED
SELECT REPLICATE('Z', 1500)
FROM ##SOURCE_IDS
OPTION (MAXDOP 1, MAX_GRANT_PERCENT = 0);

The second session waits on the first with a LCK_M_IX wait event. The first session loads all of its rows into the delta store, then deadlocks and rolls them all back. You can see this happen in near real time by looking at  sys.dm_db_column_store_row_group_physical_stats:

a19_disappearing_delta_store_rows

Here’s the deadlock XML for those who are interested in that kind of thing:

<?xml version="1.0" encoding="UTF-8"?>
<deadlock>
   <victim-list>
      <victimProcess id="process250c6d59c28" />
   </victim-list>
   <process-list>
      <process id="process250c6d59c28" taskpriority="0" logused="0" waitresource="HOBT: 5:72057594084917248 [ROWGROUP_FLUSH]" waittime="3635" ownerId="8986700" transactionname="CloseDeltastore" lasttranstarted="2017-11-12T16:51:53.260" XDES="0x250b572c490" lockMode="X" schedulerid="1" kpid="6288" status="suspended" spid="56" sbid="0" ecid="0" priority="0" trancount="2" lastbatchstarted="2017-11-12T16:51:42.827" lastbatchcompleted="2017-11-12T16:51:42.827" lastattention="1900-01-01T00:00:00.827" clientapp="Microsoft SQL Server Management Studio - Query" hostname="???????" hostpid="4404" loginname="???????\?" isolationlevel="read committed (2)" xactid="8775106" currentdb="5" lockTimeout="4294967295" clientoption1="671090784" clientoption2="390200">
         <executionStack>
            <frame procname="adhoc" line="1" stmtend="238" sqlhandle="0x020000004d878e20b5b8d311601f91ebfeb1174f657907d00000000000000000000000000000000000000000">unknown</frame>
         </executionStack>
         <inputbuf>INSERT INTO dbo.CCI_DEADLOCKED  SELECT REPLICATE('Z', 1500)  FROM ##SOURCE_IDS  OPTION (MAXDOP 1, MAX_GRANT_PERCENT = 0);</inputbuf>
      </process>
      <process id="process250bacf04e8" taskpriority="0" logused="168" waitresource="HOBT: 5:72057594085179392 " waittime="13628" ownerId="8785145" transactionname="INSERT" lasttranstarted="2017-11-12T16:51:43.267" XDES="0x2508f1ac040" lockMode="IX" schedulerid="1" kpid="6856" status="suspended" spid="54" sbid="0" ecid="0" priority="0" trancount="2" lastbatchstarted="2017-11-12T16:51:43.267" lastbatchcompleted="2017-11-12T16:51:43.250" lastattention="1900-01-01T00:00:00.250" clientapp="Microsoft SQL Server Management Studio - Query" hostname="???????" hostpid="4404" loginname="???????\?" isolationlevel="read committed (2)" xactid="8785145" currentdb="5" lockTimeout="4294967295" clientoption1="671090784" clientoption2="390200">
         <executionStack>
            <frame procname="adhoc" line="1" stmtend="238" sqlhandle="0x020000004d878e20b5b8d311601f91ebfeb1174f657907d00000000000000000000000000000000000000000">unknown</frame>
         </executionStack>
         <inputbuf>INSERT INTO dbo.CCI_DEADLOCKED  SELECT REPLICATE('Z', 1500)  FROM ##SOURCE_IDS  OPTION (MAXDOP 1, MAX_GRANT_PERCENT = 0);</inputbuf>
      </process>
   </process-list>
   <resource-list>
      <hobtlock hobtid="72057594084917248" subresource="ROWGROUP_FLUSH" dbid="5" objectname="D1.dbo.CCI_DEADLOCKED" indexname="CCI" id="lock250b52ab400" mode="S" associatedObjectId="72057594084917248">
         <owner-list>
            <owner id="process250bacf04e8" mode="S" />
         </owner-list>
         <waiter-list>
            <waiter id="process250c6d59c28" mode="X" requestType="wait" />
         </waiter-list>
      </hobtlock>
      <hobtlock hobtid="72057594085179392" subresource="FULL" dbid="5" objectname="D1.dbo.CCI_DEADLOCKED" indexname="CCI" id="lock250b5b8a280" mode="X" associatedObjectId="72057594085179392">
         <owner-list>
            <owner id="process250c6d59c28" mode="X" />
         </owner-list>
         <waiter-list>
            <waiter id="process250bacf04e8" mode="IX" requestType="convert" />
         </waiter-list>
      </hobtlock>
   </resource-list>
</deadlock>

SSMS can’t produce a deadlock graph for this type of deadlock. Below is the non-copy-and-pastable error message from it:

Failed to initialize deadlock control.
There is an error in XML document (1, 2497).
Instance validation error: ‘ROWGROUP_FLUSH’ is not a valid value for hobtlockSubresource.

Plan Explorer from SentryOne can help us:

a19_deadlock_graph

If you’re following along at home don’t forget to reset your affinity to whatever you had it before. The most common option:

ALTER SERVER CONFIGURATION
SET PROCESS AFFINITY CPU = AUTO;

The Workarounds

We’ve only observed this deadlock with multiple concurrent sessions insert to the delta store for the same target CCI due to server memory pressure or very low cardinality estimates (less than 251 rows). The correct mitigation depends on why you’re seeing the issue in the first place. If you’re seeing it due to low cardinality estimates then fix your estimates, or at the very least get them above 250 rows. If you’re seeing them because the memory grant for the CCI build times out after 25 seconds then lower concurrency or increase server memory.

The problem can also be avoided by not doing concurrent inserts in the first place. In some cases a parallel insert may be a reasonable alterative. There’s also some evidence that the deadlock is only seen when the number of rows for insert is very close to 1048576, but we weren’t able to make any definitive conclusions around that.

Final Thoughts

Don’t despair if you run into a ROWGROUP_FLUSH deadlock! There’s probably something you can do in the application to avoid it. If you feel that you shouldn’t have to take such measures feel free to vote for my connect item here.


Advertisement

Surprise Delta Stores

This post contains all of the possible causes for delta store creation that I’ve found. I cannot say with certainty that it’s a complete list, but some of them may be new or unexpected to the reader.

Why Care about Delta Stores?

Microsoft and many others will be quick to tell you that loading data into CCIs is much faster when you can bypass the delta store. In SQL Server 2016 and beyond, delta stores are uncompressed rowstore mini-tables that serve as a temporary holding data until the data can be compressed into columnar format. They’re good when you have a trickle of data to load into a CCI, but bad in all possible ways for a data warehouse workload.

Reviewing the Documentation

I briefly reviewed the documentation written by Microsoft concerning the appearance of delta stores. Here’s a quote:

Rows go to the deltastore when they are:
Inserted with the INSERT INTO VALUES statement.
At the end of a bulk load and they number less than 102,400.
Updated. Each update is implemented as a delete and an insert.

There are also a few mentions of how partitioning can lead to the creation of multiple delta stores from a single insert. It seems as if the document is incomplete or a little misleading, but I admit that I didn’t exhaustively review everything. After all, Microsoft hides columnstore documentation all over the place.

Test Data

The source data for the CCI inserts is fairly uninteresting. I put four rowgroups worth of rows into a rowstore table with a BIGINT column and a randomly generated VARCHAR(16) value.

DROP TABLE IF EXISTS dbo.STAGING_TABLE;

CREATE TABLE dbo.STAGING_TABLE (
	ID BIGINT NOT NULL,
	STR1 VARCHAR(16) NOT NULL,
	PRIMARY KEY (ID)
);

INSERT INTO dbo.STAGING_TABLE WITH (TABLOCK)
SELECT TOP (4 * 1048576)
  ROW_NUMBER() OVER (ORDER BY (SELECT NULL))
, LEFT(CAST(NEWID() AS VARCHAR(36)), 16)
FROM master..spt_values t1
CROSS JOIN master..spt_values t2
OPTION (MAXDOP 1);

The columns for the table definition for the CCI were chosen to cover all of the demos except for the partitioning one. Your fact table definitions probably don’t look like this.

DROP TABLE IF EXISTS dbo.DELTA_STORE_DUMPING_GROUND;
CREATE TABLE dbo.DELTA_STORE_DUMPING_GROUND (
	ID BIGINT NULL,
	STR1 VARCHAR(100) NULL,
	STR2 VARCHAR(100) NULL,
	STR3 VARCHAR(100) NULL,
	STR1_MAX VARCHAR(MAX) NULL,
	INDEX CCI CLUSTERED COLUMNSTORE
);

Not Enough Rows For Bulk Load

The first reason for delta creation is well known and understood on SQL Server 2016. If you insert fewer than 102400 rows then SQL Server will not attempt to skip the delta store. This behavior is by design. The following query does not do a bulk load:

INSERT INTO dbo.DELTA_STORE_DUMPING_GROUND (ID)
SELECT TOP (102399) ID
FROM dbo.STAGING_TABLE
ORDER BY ID
OPTION (MAXDOP 1);

We can see the delta store that was just created with the following query:

SELECT
    row_group_id
  , state_desc
  , total_rows
--, trim_reason_desc
--, deleted_rows
--, partition_number
FROM sys.dm_db_column_store_row_group_physical_stats rg
INNER JOIN sys.tables t ON rg.OBJECT_ID = t.OBJECT_ID
WHERE t.name = 'DELTA_STORE_DUMPING_GROUND';

The results:

a18_dmv_1

The other examples in this post use similar queries to get information about the newly added rowgroups to the table. They will be omitted for brevity. Simply inserting one row results in the delta store getting skipped:

TRUNCATE TABLE dbo.DELTA_STORE_DUMPING_GROUND;

INSERT INTO dbo.DELTA_STORE_DUMPING_GROUND (ID)
SELECT TOP (102400) ID
FROM dbo.STAGING_TABLE
ORDER BY ID
OPTION (MAXDOP 1);

Now the rowgroup is compressed:

a18_dmv_2

The rules change slightly in SQL Server 2017 with support of VARCHAR(MAX) and other LOB columns in columnstore. The delta store can be skipped with an insert of as few as 251 rows. Whether or not you write to the delta store depends on the amount of data being written. Below is one query that still writes to the delta store:

TRUNCATE TABLE dbo.DELTA_STORE_DUMPING_GROUND;

INSERT INTO dbo.DELTA_STORE_DUMPING_GROUND (STR1_MAX)
SELECT TOP (251) REPLICATE(STR1, 40)
FROM dbo.STAGING_TABLE
ORDER BY ID
OPTION (MAXDOP 1);

Once again you can see the delta store:

a18_dmv_3

Things are different if we increase the length of the inserted data. The query below writes to a compressed rowgroup and bypasses the delta store:

TRUNCATE TABLE dbo.DELTA_STORE_DUMPING_GROUND;

INSERT INTO dbo.DELTA_STORE_DUMPING_GROUND (STR1_MAX)
SELECT TOP (251) REPLICATE(STR1, 500)
FROM dbo.STAGING_TABLE
ORDER BY ID
OPTION (MAXDOP 1);

The resulting rowgroup is compressed:

a18_dmv_4

Removing just a single row from the insert brings us back to the delta store.

Inserting to Multiple Partitions

If a MAXDOP 1 INSERT query writes to multiple partitions then it could possibly write to multiple delta stores. The number of rows written to each partition is important as opposed to the total number of rows written to the table. Below I define a simple table with 2 partitions:

CREATE PARTITION FUNCTION CLUNKY_SYNTAX_1
(BIGINT)
AS RANGE LEFT
FOR VALUES (
  0
, 2000000
); 

CREATE PARTITION SCHEME CLUNKY_SYNTAX_2
AS PARTITION CLUNKY_SYNTAX_1
ALL TO ( [PRIMARY] );

DROP TABLE IF EXISTS dbo.PARTITIONED_DELTA_STORE;
CREATE TABLE dbo.PARTITIONED_DELTA_STORE (
ID BIGINT NULL,
INDEX CCI CLUSTERED COLUMNSTORE
) ON CLUNKY_SYNTAX_2 (ID);

The insert writes 200k rows to the CCI which you might expect to bypass the delta store, but since the rows are evenly spread over two partitions we end up with two delta stores:

INSERT INTO dbo.PARTITIONED_DELTA_STORE (ID)
SELECT ID
FROM dbo.STAGING_TABLE
WHERE ID BETWEEN 1900001 AND 2100000
OPTION (MAXDOP 1);

a18_dmv_5

With MAXDOP 8 INSERT queries and the maximum number of partitions defined on a table, it is possible to get 120000 delta stores. I don’t recommend doing this.

Bulk Insert Leftovers

Often applications will not insert an exact multiple of 1048576 rows. That means that rows can be left over after a few rowgroups worth of inserted rows are compressed. Those leftover rows can go into a delta store. Consider the following insert query that inserts 100000 rows more than 1048576:

TRUNCATE TABLE dbo.DELTA_STORE_DUMPING_GROUND;

INSERT INTO dbo.DELTA_STORE_DUMPING_GROUND (ID)
SELECT TOP (1048576 + 100000) ID
FROM dbo.STAGING_TABLE
ORDER BY ID
OPTION (MAXDOP 1);

As expected, the final result is one compressed rowgroup of 1048576 rows and one delta store of 100k rows.

a18_dmv_6

If we inserted just a few thousand more rows than we’d end up with two compressed rowgroups.

Updates

UPDATE queries always write to the delta store. There are many other reasons to avoid UPDATES to CCIs if the application makes it possible to do so.

TRUNCATE TABLE dbo.DELTA_STORE_DUMPING_GROUND;

INSERT INTO dbo.DELTA_STORE_DUMPING_GROUND (ID)
SELECT TOP (1048576) ID
FROM dbo.STAGING_TABLE
ORDER BY ID
OPTION (MAXDOP 1);

At first there’s just a single compressed rowgroup:

a18_dmv_7

Now run the UPDATE query and go make coffee:

UPDATE DELTA_STORE_DUMPING_GROUND
SET ID = ID;

Our table doesn’t look so hot:

a18_dmv_8

In SQL Server 2016 the Tuple Mover will not clean up this table. Another row needs to be inserted into the table before the rowgroup is marked as CLOSED.

Parallel Insert

Many parallel queries have an element of randomess around how rows are distributed to parallel threads. Rows are not moved between threads after they flow to the part of the plan that performs the insert into the CCI. It’s possible to end up with a number of new delta stores equal to the number of parallel threads for the query. Let’s start with a parallel insert that moves 4 * 1048576 rows into the CCI:

TRUNCATE TABLE dbo.DELTA_STORE_DUMPING_GROUND;

INSERT INTO dbo.DELTA_STORE_DUMPING_GROUND
WITH (TABLOCK) (ID)
SELECT ID
FROM dbo.STAGING_TABLE
OPTION (MAXDOP 4);

It’s possible to end up without any delta stores and the results of the query against sys.dm_db_column_store_row_group_physical_stats will vary, but generally you’ll get at least one:

a18_dmv_9

If we have unnaturally high beauty standards for our rowgroups we can rewrite the query to effectively force rows to be evenly distributed on all threads. The query below does this with a join to a derived table:

TRUNCATE TABLE dbo.DELTA_STORE_DUMPING_GROUND;

INSERT INTO dbo.DELTA_STORE_DUMPING_GROUND
WITH (TABLOCK) (ID)
SELECT stg.ID
FROM
(
	VALUES
	(0 * 1048576 + 1, 1 * 1048576),
	(1 * 1048576 + 1, 2 * 1048576),
	(2 * 1048576 + 1, 3 * 1048576),
	(3 * 1048576 + 1, 4 * 1048576)
)
v (start_id, end_id)
INNER JOIN dbo.STAGING_TABLE stg ON
	stg.ID BETWEEN v.start_id and v.end_id
OPTION (MAXDOP 4);

Perfection:

a18_dmv_10

I know that you were looking forward to another image of a tiny table, but here’s the important part of the query plan for those who like that sort of thing:

a18_parallel_query_plan_1

Getting perfect rowgroups can also be accomplished by adding the TOP operator to the original query, but that adds a serial zone to the plan:

TRUNCATE TABLE dbo.DELTA_STORE_DUMPING_GROUND;

INSERT INTO dbo.DELTA_STORE_DUMPING_GROUND
WITH (TABLOCK) (ID)
SELECT TOP (9999999999999999) stg.ID
FROM dbo.STAGING_TABLE stg
OPTION (MAXDOP 4);

The key here is the parallelism operator in the plan uses a round robin method for distributing rows:

a18_parallel_query_plan_2

Dictionary Pressure

In SQL Server 2016 the maximum size for a column dictionary is 16 MB. This limit is raised in SQL Server 2017 for VARCHAR(MAX) and similar columns. I’m not going to get into the details of dictionaries here but it suffices to say that columns with too many unique string columns can experience dictionary pressure. Dictionary pressure leads to compressed rows that are less than the perfect size of 1048576 rows. Let’s insert the STR1 column into the CCI this time:

TRUNCATE TABLE dbo.DELTA_STORE_DUMPING_GROUND;

INSERT INTO dbo.DELTA_STORE_DUMPING_GROUND (STR1)
SELECT TOP (1048576) stg.STR1
FROM dbo.STAGING_TABLE stg
ORDER BY ID
OPTION (MAXDOP 1);

Due to dictionary pressure there’s now a delta store with about 73000 rows:

a18_dmv_11

We can see that the dictionary size for the column is close to the limit with the query below:

SELECT csd.entry_count, csd.on_disk_size
FROM sys.column_store_dictionaries csd
INNER JOIN sys.partitions p
    ON csd.partition_id = p.partition_id
INNER JOIN sys.tables t
    ON p.OBJECT_ID = t.OBJECT_ID
WHERE t.name = 'DELTA_STORE_DUMPING_GROUND'
AND csd.column_id = 2;

Here are the results:

a18_dict

Rowgroup Memory Pressure

The memory grant for CCI compression for an INSERT is calculated based on DOP and column definitions of target columns in the target table. The memory grant can be insufficient to get a full 1048576 rows into a compressed rowgroup depending on the table definition and the characteristics of the data getting loaded into the table. Consider an example in which data is loaded into three columns of the CCI:

TRUNCATE TABLE dbo.DELTA_STORE_DUMPING_GROUND;

INSERT INTO dbo.DELTA_STORE_DUMPING_GROUND
(STR1, STR2, STR3)
SELECT TOP (1048576)
  LEFT(STR1, 10)
, LEFT(STR1, 5)
, LEFT(STR1, 6)
FROM
dbo.STAGING_TABLE stg
ORDER BY ID
OPTION (MAXDOP 1);

With the above syntax the memory grant is calculated from just the STR1, STR2, and STR3 columns. The memory grant of 171152 KB isn’t enough to avoid a delta store:

a18_dmv_12

Note that you may not see the same results on your machine due to the randomness of the source data. For my table and source data set, adding a single column and inserting NULL into it bumps the memory grant up enough to avoid memory pressure:

TRUNCATE TABLE dbo.DELTA_STORE_DUMPING_GROUND;

ALTER TABLE dbo.DELTA_STORE_DUMPING_GROUND
ADD MORE_MEMORY_PLZ VARCHAR(1) NULL;

INSERT INTO dbo.DELTA_STORE_DUMPING_GROUND
(STR1, STR2, STR3, MORE_MEMORY_PLZ)
SELECT TOP (1048576)
  LEFT(STR1, 10)
, LEFT(STR1, 5)
, LEFT(STR1, 6)
, NULL
FROM
dbo.STAGING_TABLE stg
ORDER BY ID
OPTION (MAXDOP 1);

The compressed rowgroup contains 1048576 rows now that memory pressure has been addressed.

a18_dmv_13

Cardinality Estimate Less Than 251 Rows

SQL Server won’t even ask for a memory grant if the cardinality estimate is less than 251 rows. Perhaps this is because the memory grant would be wasted unless at least 102400 rows were inserted into the table. There’s no second chance at a memory grant here, so it’s possible to insert millions of rows to delta stores. A TOP expression with a variable will default to a cardinality estimate of 100 rows, so this works nicely to show the behavior:

TRUNCATE TABLE dbo.DELTA_STORE_DUMPING_GROUND;

DECLARE @top_rows BIGINT = 1048576;
INSERT INTO dbo.DELTA_STORE_DUMPING_GROUND (ID)
SELECT TOP (@top_rows) ID
FROM dbo.STAGING_TABLE
ORDER BY ID
OPTION (MAXDOP 1);

Despite inserting 1048576 rows we aren’t able to bypass the delta store:

a18_dmv_14

The same behavior can be observed with a cardinality estimate of 250 rows. The OPTIMIZE FOR query hint is used to control the estimate.

TRUNCATE TABLE dbo.DELTA_STORE_DUMPING_GROUND;

DECLARE @top_rows BIGINT = 1048576;
INSERT INTO dbo.DELTA_STORE_DUMPING_GROUND (ID)
SELECT TOP (@top_rows) ID
FROM dbo.STAGING_TABLE
ORDER BY ID
OPTION (MAXDOP 1, OPTIMIZE FOR (@top_rows = 250));

However, if I bump up the estimate by one more row a memory grant is given to the query and the delta store is bypassed:

TRUNCATE TABLE dbo.DELTA_STORE_DUMPING_GROUND;

DECLARE @top_rows BIGINT = 1048576;
INSERT INTO dbo.DELTA_STORE_DUMPING_GROUND (ID)
SELECT TOP (@top_rows) ID
FROM dbo.STAGING_TABLE
ORDER BY ID
OPTION (MAXDOP 1, OPTIMIZE FOR (@top_rows = 251));

a18_dmv_15

Under this scenario we’ve observed deadlocks when multiple sessions insert into delta stores from the same target table.

Extreme Server Memory Pressure

Memory grants for queries that insert into CCIs have a hardcoded timeout of 25 seconds. After 25 seconds they execute with required serial memory and always write to the delta store. In the query below I simulate memory pressure with a MAX_GRANT_PERCENT hint of 0:

TRUNCATE TABLE dbo.DELTA_STORE_DUMPING_GROUND;

INSERT INTO dbo.DELTA_STORE_DUMPING_GROUND (ID)
SELECT TOP (1048576) ID
FROM dbo.STAGING_TABLE
ORDER BY ID
OPTION (MAXDOP 1, MAX_GRANT_PERCENT = 0);

The query always writes to the delta store. It cannot compress data without a memory grant.

a18_dmv_15

Under this scenario we’ve observed deadlocks when multiple sessions insert into delta stores from the same target table.

Final Thoughts

It took forever to do the formatting for this one, so I hope that someone finds it useful.

A Row Goal Request

If you don’t know about row goals I strongly recommend reading up on them here. Queries with plans similar to the following may sometimes take longer than expected to finish:

a16_suspicious_query

This can happen even in SQL Server 2017 with very representative statistics and perfect cardinality estimates. This post digs into why these performance degradations can happen and proposes a way to prevent them.

The Test Data

For test data I threw about a million rows into a heap. There are exactly 1000 unique values for the ID column. The table is about 1 GB in size.

DROP TABLE IF EXISTS dbo.BIG_HEAP;

CREATE TABLE dbo.BIG_HEAP (
	ID BIGINT NOT NULL,
	PAGE_FILLER VARCHAR(900) NOT NULL
);

-- table is about 1 GB in size
INSERT INTO dbo.BIG_HEAP WITH (TABLOCK)
SELECT
  RN
, REPLICATE ('Z', 900)
FROM
(
	SELECT TOP (1000000)
		ROW_NUMBER()
		OVER (ORDER BY (SELECT NULL)) % 1000 RN
	FROM master..spt_values t1
	CROSS JOIN master..spt_values t2

	UNION ALL

	SELECT TOP (1000) 0 RN
	FROM master..spt_values t1
	CROSS JOIN master..spt_values t2
) t
OPTION (MAXDOP 1);

CREATE STATISTICS S ON dbo.BIG_HEAP (ID)
WITH FULLSCAN, NORECOMPUTE;

The histogram isn’t as compact as it theoretically could be, but I would say that it represents the data very well:

a16_rowstore_histogram

Through the histogram it’s easy to see that there are 1000 distinct values for the ID column. There are 2000 rows with an ID of 0 and 1000 rows for IDs between 1 and 999.

The data is evenly distributed on disk. This behavior isn’t guaranteed because we’re inserting into a heap, but what counts is that it remains true during the testing period. We can get the first row with any ID in the table by reading 1000 rows or fewer from the heap. Below are a few examples:

-- rows read from table = 1
SELECT TOP (1) ID
FROM dbo.BIG_HEAP
WHERE ID = 1;

-- rows read from table = 500
SELECT TOP (1) ID
FROM dbo.BIG_HEAP
WHERE ID = 500;

-- rows read from table = 999
SELECT TOP (1) ID
FROM dbo.BIG_HEAP
WHERE ID = 999;

-- rows read from table = 1000
SELECT TOP (1) ID
FROM dbo.BIG_HEAP
WHERE ID = 0;

Approximate Formula for Scan Costing with a Row Goal

After some investigation I was able to come up with an approximate formula for the cost of a scan with a row goal applied to it. The formula has rounding and other issues but it illustrates the general behavior quite well. Here it is:

scan cost in optimizer units = 0.0031895 + LEAST(1, ROW_GOAL / CARDINALITY_ESTIMATE) * (FULL_SCAN_COST – 0.0031895)

I assume that the 0.0031895 constant is there to represent the minimum amount of work required to read a single row from a table. The ROW_GOAL parameter will just be the number of rows limited by TOP in our example queries. The CARDINALITY_ESTIMATE parameter is the number of rows estimated to be returned by SQL Server if there was no row goal. The FULL_SCAN_COST parameter is the cost in optimizer units of a single scan that reads all of the rows from the table. For BIG_HEAP this has a value of 93.7888.

SQL Server assumes that rows are evenly distributed in the table when reducing the cost of the scan. It’s certainly possible to take issue with that assumption, but this blog post does not go in that direction. In fact, I loaded the data into BIG_HEAP in such a way so that assumption would be largely true. The basic idea behind the formula is that if there are two matching rows in a table and a query needs to get just one of them, then on average the query optimizer thinks that half of the rows will need to be read from the table.

Let’s start with a few simple examples. If a row goal exceeds the total number of rows in a table then we shouldn’t expect it to change the cost of a scan. For this query:

SELECT TOP (7654321) ID
FROM dbo.BIG_HEAP;

The formula simplifies to 0.0031895 + (1) * (93.7888 - 0.0031895) = 93.7888 units which is exactly the cost of the scan.

Consider a query that selects the first row without any filtering:

SELECT TOP (1) ID
FROM dbo.BIG_HEAP;

The ROW_GOAL is 1 and the CARDINALITY_ESTIMATE is the number of rows in the table, 1001000. The formula gives a cost of 0.0031895 + (1 / 1001000) * (93.7888 - 0.0031895) = 0.00328319191 units which is fairly close to the actual cost of 0.0032831 units.

The formula also works for the classic SELECT TOP (0) query. The query below does not contain a scan of the heap so it could be said that the cost of the scan is 0 units.

SELECT TOP (0) ID
FROM dbo.BIG_HEAP;

For a less trivial example consider the following query:

SELECT TOP (3) ID
FROM dbo.BIG_HEAP
WHERE ID = 1;

The ROW_GOAL is 3 and the CARDINALITY_ESTIMATE is 1000. The formula gives a cost of 0.0031895 + (3 / 1000) * (93.7888 - 0.0031895) = 0.2845463315 units. The scan cost reported by SQL Server is 0.284546 units.

Consider the following query:

SELECT TOP (1) ID
FROM dbo.BIG_HEAP
WHERE ID = 0;

The ROW_GOAL is 1 and the CARDINALITY_ESTIMATE is 2000. The formula gives a cost of 0.0031895 + (1 / 2000) * (93.7888 - 0.0031895) = 0.05008230525 units. The scan cost reported by SQL Server is 0.0500822 units.

An estimate based on density gives what you might expect. Consider the following query:

DECLARE @var BIGINT = 1;
SELECT TOP (1) ID
FROM dbo.BIG_HEAP
WHERE ID = @var
OPTION (MAXDOP 1);

Here the cardinality estimate will be 1001 rows. The formula gives a cost of 0.0031895 + (1 / 1001) * (93.7888 - 0.0031895) = 0.09688141858 units. The scan cost reported by SQL Server is 0.0968814 units.

Approximate Formula for Join Scan Costing with a Row Goal

The truly interesting part is how the scan cost changes due to a row goal when it’s on the inner side of a nested loop join. To model the cost we need to make a few changes to the above formula. First we need a way to approximate the cost of each successive scan. Let’s create a small, single column table:

CREATE TABLE dbo.SMALL_TABLE (
	ID BIGINT NOT NULL
);

CREATE STATISTICS S ON dbo.SMALL_TABLE (ID);

For cross joins, the cost increases at a linear rate of 46.382 optimizer units per execution of the scan. It’s not clear to me where this number comes from. I assume SQL Server discounts each scan after the first because some of the data will be in the buffer cache. I tested this by throwing a few rows into SMALL_TABLE and getting an estimated plan for the following query:

SELECT *
FROM dbo.SMALL_TABLE s
CROSS JOIN dbo.BIG_HEAP b
OPTION (NO_PERFORMANCE_SPOOL, FORCE ORDER);

With 1 row the cost was 93.7888 units, with 2 rows the cost was 140.17 units, with 3 rows the cost was 186.552 units, and so on. We can use the formula from before to try to approximate the cost. The first scan has a cost according to the following (same as before):

0.0031895 + LEAST(1, ROW_GOAL / CARDINALITY_ESTIMATE) * (FULL_SCAN_COST – 0.0031895)

Each successive scan has a cost according to the following:

0.0031895 + LEAST(1, ROW_GOAL / CARDINALITY_ESTIMATE) * (REDUCED_FULL_SCAN_COST – 0.0031895)

This isn’t as accurate as it is for a single scan without a join. There’s a missing piece that I wasn’t able to find. However, it works well enough to later illustrate the problem with costing.

Let’s reset SMALL_TABLE and insert five rows:

TRUNCATE TABLE dbo.SMALL_TABLE;

INSERT INTO dbo.SMALL_TABLE VALUES (500);
INSERT INTO dbo.SMALL_TABLE VALUES (501);
INSERT INTO dbo.SMALL_TABLE VALUES (502);
INSERT INTO dbo.SMALL_TABLE VALUES (503);
INSERT INTO dbo.SMALL_TABLE VALUES (504);

UPDATE STATISTICS SMALL_TABLE S WITH FULLSCAN;

Here is the query that we’ll be testing with for the next few tests:

SELECT *
FROM dbo.SMALL_TABLE s
WHERE NOT EXISTS
(
	SELECT 1
	FROM dbo.BIG_HEAP b
	WHERE s.ID = b.ID
);

The plan has a final cardinality estimate of a single row and looks like this:

a16_scan_1_row_ce

Using the previous formulas we could expect the cost of the scan to be 0.0031895 + (1 / 1000) * (93.7888 - 0.0031895) + 4 * (0.0031895 + (1 / 1000) * (46.382 - 0.0031895)) = 0.2952483525. The actual cost is 0.294842 units so it’s kind of close.

If we change one of the values to 0 we should expect a slight reduction in cost because SQL Server might think that it needs to scan fewer rows to find a row with an ID of 0.

TRUNCATE TABLE dbo.SMALL_TABLE;

INSERT INTO dbo.SMALL_TABLE VALUES (0);
INSERT INTO dbo.SMALL_TABLE VALUES (501);
INSERT INTO dbo.SMALL_TABLE VALUES (502);
INSERT INTO dbo.SMALL_TABLE VALUES (503);
INSERT INTO dbo.SMALL_TABLE VALUES (504);

UPDATE STATISTICS SMALL_TABLE S WITH FULLSCAN;

This does not happen. The cost remains the same as before: 0.294842 units. This is because the scan is costed according to density instead of by looking at the histogram of the outer table. The following query with a local variable repeated five times also has a cost of 0.294842 optimizer units:

DECLARE @var BIGINT = 1;
SELECT *
FROM (
VALUES (@var), (@var), (@var), (@var), (@var)
) s (ID)
WHERE NOT EXISTS
(
	SELECT 1
	FROM dbo.BIG_HEAP b
	WHERE s.ID = b.ID
)
OPTION (NO_PERFORMANCE_SPOOL);

The problem with using density instead of looking at the data in the outer table is mostly apparent when the outer table contains rows without a match in the inner table. Consider the following data:

TRUNCATE TABLE dbo.SMALL_TABLE;

INSERT INTO dbo.SMALL_TABLE VALUES (-1);
INSERT INTO dbo.SMALL_TABLE VALUES (-2);
INSERT INTO dbo.SMALL_TABLE VALUES (-3);
INSERT INTO dbo.SMALL_TABLE VALUES (-4);
INSERT INTO dbo.SMALL_TABLE VALUES (-5);

UPDATE STATISTICS SMALL_TABLE S WITH FULLSCAN;

The query has a final cardinality estimate of five rows which is different than before. However, it still costs the scan as 0.294842 units. This is a problem. We know that SQL Server will need to read the entire table for each row that is returned to the client. For this query 5005000 rows are read from the heap.

The Request

The cost reduction for the row goal feels too aggressive with an anti join. If even a single row is output from the join that means that all of the rows were scanned from the table for that row. Is that really better than a hash join? The query optimizer is already doing the work of estimating how many rows will be output from the join. Even using the density of matched rows and assuming full scans for unmatched rows may be a significant improvement over the current model of always using density. This would also be more consistent with the costing of individual scans.

The Good

The optimizer is using density to calculate the cost of the scan, so it’s reasonable to think that we’ll get an efficient plan if SMALL_TABLE contains rows that mostly exist in BIG_HEAP. For integers between 1 and 1000 only one row will be returned to the client with an ID of 1000.

TRUNCATE TABLE dbo.SMALL_TABLE;

INSERT INTO dbo.SMALL_TABLE WITH (TABLOCK)
SELECT TOP (1000)
	ROW_NUMBER()
	OVER (ORDER BY (SELECT NULL))
FROM master..spt_values t1
CROSS JOIN master..spt_values t2

UPDATE STATISTICS SMALL_TABLE S WITH FULLSCAN;

We continue to test with this query:

SELECT *
FROM dbo.SMALL_TABLE s
WHERE NOT EXISTS
(
	SELECT 1
	FROM dbo.BIG_HEAP b
	WHERE s.ID = b.ID
)
OPTION (MAXDOP 1);

This query gets a nested loop anti join with a TOP operator:

a16_good_query

It finishes in less than a second on my machine. About 1.5 million rows in total are read from the heap which is no problem:

a16_good_rows_read

The Bad

Performance changes pretty drastically if we put rows into SMALL_TABLE that don’t have a match in BIG_HEAP. As explained earlier, each row returned to the client requires a full scan of the BIG_HEAP table. Consider the following data set for SMALL_TABLE:

TRUNCATE TABLE dbo.SMALL_TABLE;

INSERT INTO dbo.SMALL_TABLE WITH (TABLOCK)
SELECT TOP (1000)
	- 1 * ROW_NUMBER()
	OVER (ORDER BY (SELECT NULL))
FROM master..spt_values t1
CROSS JOIN master..spt_values t2

UPDATE STATISTICS SMALL_TABLE S WITH FULLSCAN;

Once again we’re using the same query:

SELECT *
FROM dbo.SMALL_TABLE s
WHERE NOT EXISTS
(
	SELECT 1
	FROM dbo.BIG_HEAP b
	WHERE s.ID = b.ID
) OPTION (MAXDOP 1);

All 1000 rows will be returned to the client, so one billion rows will be read from the BIG_HEAP table. This is indeed what happens and the query takes around 2 minutes to complete on my machine. It’s important to note that SQL Server calculates the correct final cardinality estimate of 1000 rows:

a16_bad_plan

The query optimizer already does the work to figure out that there won’t be any rows returned from the BIG_HEAP table. It would be helpful if it used this knowledge to cost the scan of BIG_HEAP more accurately. The cost of the scan is 0.294842 optimizer units which obviously does not reflect reality.

If a cached scan that reads all of the rows from the table has a cost of around 46.382 units then it seems reasonable to expect that the cost of 1000 scans will be at least 46382 optimizer units, even with the row goal applied. That cost would result in a hash join or some other plan being naturally chosen by the optimizer. Forcing a hash join has an overall cost of 100.393 optimizer units but the query finishes in under one second.

Until we get better costing in this area, one workaround is to use trace flag 4138 or the DISABLE_OPTIMIZER_ROWGOAL use hint.

The Ugly

We can also see performance issues with CCIs. Below I insert 100 million rows into a CCI with roughly the same data distribution as the BIG_HEAP table. This took a few minutes on my machine.

DROP TABLE IF EXISTS dbo.CCI_ROW_GOAL;

CREATE TABLE dbo.CCI_ROW_GOAL (
	ID BIGINT NOT NULL,
	INDEX CCI CLUSTERED COLUMNSTORE
);

INSERT INTO dbo.CCI_ROW_GOAL WITH (TABLOCK)
SELECT TOP (100000000)
	ROW_NUMBER()
	OVER (ORDER BY (SELECT NULL)) % 1000 RN
FROM master..spt_values t1
CROSS JOIN master..spt_values t2
CROSS JOIN master..spt_values t3
OPTION (MAXDOP 1);

CREATE STATISTICS S ON dbo.CCI_ROW_GOAL (ID)
WITH FULLSCAN, NORECOMPUTE;

Once again I would say that the histogram represents the data well. You can take my word for it. Just to make sure that SMALL_TABLE has the right data we’ll reset it:

TRUNCATE TABLE dbo.SMALL_TABLE;

INSERT INTO dbo.SMALL_TABLE WITH (TABLOCK)
SELECT TOP (1000)
	- 1 * ROW_NUMBER()
	OVER (ORDER BY (SELECT NULL))
FROM master..spt_values t1
CROSS JOIN master..spt_values t2

UPDATE STATISTICS SMALL_TABLE S WITH FULLSCAN;

The query below is very familiar but we’ll start by forcing a hash join. The overall query cost is 0.126718 optimizer units and it finishes in less than a second.

SELECT *
FROM dbo.SMALL_TABLE s
WHERE NOT EXISTS
(
	SELECT 1
	FROM dbo.CCI_ROW_GOAL b
	WHERE s.ID = b.ID
) OPTION (MAXDOP 1, HASH JOIN);

I wouldn’t describe the plan as interesting:

a16_boring_CCI plan

The plan changes if the HASH JOIN hint is removed:

a16_bad_cci_plan

This is a very alarming plan. It has an overall cost of 2.00464 optimizer units, but the scan is in row mode instead of batch mode. For the query to complete it will need to read about 100 billion rows from the CCI in row mode. On my machine I let it run for a little while and it looked like the query would take around 3.5 hours to complete.

Once again the optimizer expects that all 1000 rows from SMALL_TABLE will be returned to the client. The inefficient plan could be avoided with more sophisticated costing for the row goal applied to the CCI scan.

Final Thoughts

I submitted a Connect item asking for an enhancement to row goal costing on the inner side of an anti join. If you have time please login and vote your conscience. Thanks for reading!

An Adaptive Join Regression

Adaptive joins are a new feature in SQL Server 2017. For adaptive join operators the decision to do a hash or loop join is deferred until enough input rows are counted. You can get an introduction on the topic in this blog post by Joe Sack. Dmitry Pilugin has an excellent post digging into the internals. The rest of this blog post assumes that you know the basics of adaptive joins.

Getting an Adaptive Join

It’s pretty easy to create a query that has an adaptive join in SQL Server 2017. Below I create a CCI with 100k rows and an indexed rowstore table with 400k rows:

DROP TABLE IF EXISTS dbo.MY_FIRST_CCI;

CREATE TABLE dbo.MY_FIRST_CCI (
	FILTER_ID_1 INT NOT NULL,
	FILTER_ID_2 INT NOT NULL,
	FILTER_ID_3 INT NOT NULL,
	JOIN_ID INT NOT NULL,
	INDEX CI CLUSTERED COLUMNSTORE
);

INSERT INTO dbo.MY_FIRST_CCI WITH (TABLOCK)
SELECT TOP (100000)
  t.RN
, t.RN
, t.RN
, t.RN
FROM
(
	SELECT ROW_NUMBER() OVER (ORDER BY (SELECT NULL)) RN
	FROM master..spt_values t1
	CROSS JOIN master..spt_values t2
) t
OPTION (MAXDOP 1);

ALTER TABLE dbo.MY_FIRST_CCI REBUILD WITH (MAXDOP = 1);

CREATE STATISTICS S1 ON dbo.MY_FIRST_CCI (FILTER_ID_1)
WITH FULLSCAN;
CREATE STATISTICS S2 ON dbo.MY_FIRST_CCI (FILTER_ID_2)
WITH FULLSCAN;
CREATE STATISTICS S3 ON dbo.MY_FIRST_CCI (FILTER_ID_3)
WITH FULLSCAN;
CREATE STATISTICS S4 ON dbo.MY_FIRST_CCI (JOIN_ID)
WITH FULLSCAN;

DROP TABLE If exists dbo.SEEK_ME;

CREATE TABLE dbo.SEEK_ME (
	JOIN_ID INT NOT NULL,
	PADDING VARCHAR(2000) NOT NULL,
	PRIMARY KEY (JOIN_ID)
);

INSERT INTO dbo.SEEK_ME WITH (TABLOCK)
SELECT TOP (400000)
  ROW_NUMBER() OVER (ORDER BY (SELECT NULL))
, REPLICATE('Z', 2000)
FROM master..spt_values t1
CROSS JOIN master..spt_values t2

CREATE STATISTICS S1 ON dbo.SEEK_ME (JOIN_ID)
WITH FULLSCAN;

The full scan stats are just there to show that there isn’t any funny business with the stats. The below query gets an adaptive join:

SELECT *
FROM dbo.MY_FIRST_CCI o
INNER JOIN dbo.SEEK_ME i ON o.JOIN_ID = i.JOIN_ID

It’s obvious when it happens in SSMS:

a16_sample_adaptive_join

It’s possible to get an adaptive join with even simpler table definitions. I created the tables this way because they’ll be used for the rest of this post.

Adaptive Threshold Rows

Unlike some other vendors, Microsoft was nice enough to expose the adaptive row threshold in SSMS when looking at estimated or actual plans:

a16_threshold

The adaptive join saves input rows to a temporary structure and acts as a blocking operator until it makes a decision about which type of join to use. In this example, if there are less than 80388.3 rows then the adaptive join will execute as a nested loop join. Otherwise it’ll execute as a hash join.

The adaptive threshold row count can change quite a bit based on the input cardinality estimate. It changes to 22680 rows if I add the following filter that results in a single row cardinality estimate:

WHERE o.FILTER_ID_1 = 1

It was surprising to me to see so much variance for this query. There must be some overhead with doing the adaptive join but I wouldn’t expect the tipping point between a loop and hash join to change so dramatically. I would expect it to be close to a traditional tipping point calculated without adaptive joins.

Traditional Tipping Point

Let’s disable adaptive joins using the 'DISABLE_BATCH_MODE_ADAPTIVE_JOINS' USE HINT and consider how an execution plan would look for this query:

SELECT *
FROM dbo.MY_FIRST_CCI o
INNER JOIN dbo.SEEK_ME i ON o.JOIN_ID = i.JOIN_ID
WHERE o.FILTER_ID_1 BETWEEN @start AND @end
OPTION (
RECOMPILE,
USE HINT('DISABLE_BATCH_MODE_ADAPTIVE_JOINS')
);

We should expect a hash join if the local variables don’t filter out as many rows. Conversely, we should expect a loop join if the local variables on FILTER_ID_1 filter out many rows from the table. There’s a tipping point where the plan will change from a hash join to a loop join if we filter out a single additional row . On my machine, the tipping point is between 48295 and 48296 rows:

a16_fixed_tipping_point.PNG

The estimated costs for the two queries are very close to each other: 74.6842 and 74.6839 optimizer units. However, we saw earlier that the tipping point for an adaptive join on this query can vary between 22680 and 80388.3 rows. This inconsistency means that we can find a query that performs worse with adaptive joins enabled.

The Regression

After some trial and error I found the following query:

SELECT *
FROM dbo.MY_FIRST_CCI o
INNER JOIN dbo.SEEK_ME i ON o.JOIN_ID = i.JOIN_ID
WHERE o.FILTER_ID_1 BETWEEN 1 AND 28000
AND o.FILTER_ID_2 BETWEEN 1 AND 28000
AND o.FILTER_ID_3 BETWEEN 1 AND 28000
ORDER BY (SELECT NULL)
	OFFSET 100001 ROWS FETCH NEXT 1 ROW ONLY
OPTION (MAXDOP 1);

The ORDER BY stuff isn’t important. It’s there just to not send any rows over the network. Here’s the plan:

a16_regression

The query has a cardinality estimate of 10777.7 rows coming out of the MY_FIRST_CCI table. The adaptive join has a tipping point of 27611.6 rows. However, I’ve constructed the table and the filter such that 28000 rows will be sent to the join. SQL Server expects a loop join, but it will instead do a hash join because 28000 > 27611.6. With a warm cache the query takes almost half a second:

CPU time = 469 ms, elapsed time = 481 ms.

If I disable adaptive joins, the query finishes in less than a fifth of a second:

CPU time = 172 ms, elapsed time = 192 ms.

A loop join is a better choice here, but the adaptive row threshold makes the adaptive join pick a hash join.

Final Thoughts

This post contains only a single test query, so it’s no cause for panic. It’s curious that Microsoft made the adaptive join tipping so dependent on cardinality estimates going into the join. I’m unable to figure out the design motivation for doing that. I would expect the other side of the join to be much more important. Thanks for reading!

A Serial Parallel Query

Sometimes parallel queries perform poorly due to bad luck. The parallel page supplier may distribute rows in a way that’s not optimal for performance. The hashing function used by SQL Server to split rows into threads may assign too many rows to a single thread. You may have seen some of these situations in production queries, but they can be hard to reproduce because they may depend on a lot of different factors including the complete data in some of the involved tables. This blog post demonstrates a technique to create demos that show how parallel thread imbalance can lead to poor performance.

Mapping Hash Partition Destination Threads

This work is inspired by a recent blog post at sql.sasquatch by my friend and colleague @sqL_handLe. For a given data type and DOP it appears that the same hashing function and thread boundaries are always applied, although I haven’t confirmed that. In other words, if an INT of value 1 in a parallel MAXDOP 4 query gets hashed to thread 2 in a query, then it may also get hashed to thread 2 from a different table in a different query. In other words, it appears to be possible to figure out ahead of time where different values will be hashed to. That means that it’s possible to construct a data set with very poor thread balance.

To create the mapping we need to construct a data set that makes it easy to tell which value gets sent to which thread. I inserted 20 distinct values into a table with each value having a row count equal to a different power of 2. Sample code to do this:

DROP TABLE IF EXISTS dbo.FIND_HASH_VALUES;

CREATE TABLE dbo.FIND_HASH_VALUES (
ID INT NOT NULL
);

DECLARE @start_num INT = 0;

INSERT INTO dbo.FIND_HASH_VALUES WITH (TABLOCK)
SELECT t.n
FROM
(
	SELECT v.n + @start_num AS n
	, ROW_NUMBER() OVER (ORDER BY v.n) RN
	FROM (
	VALUES
	  (1), (2), (3), (4), (5)
	, (6), (7), (8), (9), (10)
	, (11), (12), (13), (14), (15)
	, (16), (17), (18), (19), (20)
	) v(n)
) t
CROSS APPLY (
	SELECT TOP (POWER(2, -1 + t.RN)) 1 dummy
	FROM master..spt_values t1
	CROSS JOIN master..spt_values t2
) ca
OPTION (MAXDOP 1);

The above code runs in about a second on my machine. To see which value goes to which thread I need a query with a repartition streams operator that has the hash partitioning type. One way to get this is with window functions. The following query naturally goes parallel on my machine and has the operator that I’m looking for:

SELECT TOP 1
  ID
, COUNT(*) OVER (PARTITION BY ID) CNT
FROM FIND_HASH_VALUES
OPTION (MAXDOP 4);

The TOP 1 isn’t essential. It’s there to limit the size of the result set. The query finishes quickly and rows are sent to all four threads:

a15_threads

Decoding which value went to which thread can be done in SQL Server using the & operator. The query below finds the thread number for the 20 distinct values in the table:

DECLARE
@start_num INT = 0,
@thread1 INT = 61440,
@thread2 INT = 330245,
@thread3 INT = 240,
@thread4 INT = 656650;

SELECT t.ID
, cast(@thread1 & t.bit_comp as bit)
+ 2 * cast(@thread2 & t.bit_comp as bit)
+ 3 * cast(@thread3 & t.bit_comp as bit)
+ 4 * cast(@thread4 & t.bit_comp as bit) AS THREAD
FROM
(
	SELECT v.n + @start_num AS ID
	, POWER(2, -1 + ROW_NUMBER()
		OVER (ORDER BY v.n)) bit_comp
	FROM (
	VALUES
	  (1), (2), (3), (4), (5)
	, (6), (7), (8), (9), (10)
	, (11), (12), (13), (14), (15)
	, (16), (17), (18), (19), (20)
	) v(n)
) t;

Here’s the result set:

a15_bitmap_results

Getting the mapping for other ranges of IDs is as simple as changing the variables for both queries. I put the first 100 values on pastebin in case it’s useful for someone.

The Data Set

For demo purposes I want a table that contains values that will always hash to the same thread at MAXDOP 4. You can find 25 values that hash to the same thread in the pastebin. In the table below I insert 100k rows for each unique value that goes to thread 1:.

DROP TABLE IF EXISTS dbo.SKEWED_DATA;

CREATE TABLE dbo.SKEWED_DATA (
ID INT NOT NULL,
FILLER VARCHAR(50)
);

INSERT INTO dbo.SKEWED_DATA WITH (TABLOCK)
SELECT t.n, 'Lamak'
FROM
(
	SELECT v.n
	FROM (
	VALUES
	  (13), (14), (15), (16)
	, (30), (31), (32), (33)
	, (46), (47), (48), (49), (50)
	, (63), (64), (65), (66)
	, (80), (81), (82), (83)
	, (97), (98), (99), (100)
	) v(n)
) t
CROSS APPLY (
	SELECT TOP (100000) 1 dummy
	FROM master..spt_values t1
	CROSS JOIN master..spt_values t2
) ca
OPTION (MAXDOP 1);

CREATE STATISTICS S ON dbo.SKEWED_DATA (ID) WITH FULLSCAN;

The Query

The business requirement of the day is to take the first 2.5 million rows from the SKEWED_DATA table, calculate the row number partitioned by ID, and to return all rows with a row number greater than 100k. The query will never return any results based on how data was inserted into the table. Here is one way to express such a query:

SELECT ID, FILLER
FROM
(
	SELECT
	  ID
	, FILLER
	, ROW_NUMBER() OVER (PARTITION BY ID
		ORDER BY (SELECT NULL)) RN
	FROM
	(
		SELECT TOP (2500000)
		    ID
		  , FILLER
		FROM dbo.SKEWED_DATA
	) t
) t2
WHERE t2.RN > 100000
OPTION (MAXDOP 4);

The query runs at MAXDOP 4 but does not benefit from parallelism at all. All of the rows are sent to the same thread:

a15_terrible_parallel_query

The sort spills to tempdb because the memory grant for the sort is split evenly across all four threads. Threads 2-4 don’t get any rows so 75% of the memory grant is wasted:

a15_memory

I ran the query five times and it executed in an average of 2816 ms. CPU time was generally pretty close to the elapsed time. This is a very bad example of a parallel query.

Lowering DOP

The query above is designed to not be able to take advantage of parallelism. The useless repartition streams step and the spill to tempdb suggest that the query might perform better with a MAXDOP 1 hint. With a MAXDOP 1 hint the query runs with an average time of 2473 ms. There is no longer a spill to tempdb.

What happens if the query is run with MAXDOP 3? Earlier I said that the hashing function or thread boundaries can change based on DOP. With MAXDOP 3 I get a much more even row distribution on threads:

a15_good_threads

The better distribution of rows means that the spill to tempdb does not happen either:

a15_good_memory

The query definitely seems like it could benefit from parallelism. After five runs it had an average execution time of 1563 ms, almost a 50% improvement over the MAXDOP 4 query. The ratio of CPU time to elapsed time is also much more in line with what we might expect from a good parallel query:

CPU time = 3219 ms, elapsed time = 1574 ms.

Final Thoughts

It was fun to construct a query that runs faster when MAXDOP is lowered from 4 to 3. Hopefully the details were interesting in of themselves. Thanks for reading!

Hash Partitioned Exchange Spills

This blog post contains a few demos for generating hash partitioned exchange spills. It does not attempt to explain why performance is so bad in some cases, but I think that the behavior here is simply interesting to observe. Note that all of the demos were done on SQL Server 2016 SP1 CU4. Some of this may not be reproducible on other versions.

Order Preserving Streams

First I need to say a few words about repartition and gather streams operators. Here’s an example of one:

a14_operator

These operators are easy to misunderstand. Even when they have an “order by” they do not directly do a sort in the traditional sense. Instead, they rely on the ordered input threads to produce 1 or more ordered output threads. There’s no memory grant associated with them. For an illustration of how this could work, consider a very simple example with 4 rows on two threads:

a14_order_preserving

After the first step, values 1 and 2 from thread 1 are processed. There is a switch to thread 2 that moves 3, 4, and 5, and so on. This all explained in a much better way by Paul White in his talk on parallelism at the 2013 PASS Summit:

What is an Exchange Spill?

As usual, the good stuff is hidden in extended event descriptions:

Occurs when the memory communication buffers for a query with multiple Parallelism operators become full, resulting in one of the operators writing to TempDB. If this happens multiple times in a single query plan the query performance is impacted. Use this event in conjunction with any of the *_showplan events to determine which operation in the generated plan is causing the exchange spill using the node_id field

According to Paul White, one way to get a deadlock is when the buffers are full but there aren’t any rows on one of the threads. There is a brilliant demo that involves partitioning by round robin near the end of the talk that starts here:

This blog post focuses on deadlocks that occur with hash partitioning.

The Test Query

Only one table is needed to see exchange spills caused by hash partitioning. The first column stores the ID used for the join and the second column is used to pad out the pages. The clustered index isn’t a primary key to allow for duplicate values. Table definition:

DROP TABLE IF EXISTS DEADLOCK;

CREATE TABLE DEADLOCK (
	ID BIGINT NOT NULL,
	FLUFF VARCHAR(100)
);

CREATE CLUSTERED INDEX CI__DEADLOCK ON DEADLOCK (ID);

The query that I’ll run forces a parallel merge join with varying MAXDOP:

SELECT t1.ID
FROM DEADLOCK t1
WHERE EXISTS (
       SELECT 1
       FROM DEADLOCK t2
       WHERE t1.ID = t2.ID
)
ORDER BY t1.ID
OPTION (QUERYTRACEON 8649, MERGE JOIN, MAXDOP 2);

With this query, we can force an order preserving repartition streams to be hashed against a column with as few distinct values as we like. Note that there is an element of chance to this. For some data distributions a deadlock may not always occur. The performance of the same query can vary to an extreme degree as well.

Getting a Deadlock

One way to see a deadlock is by putting 50k rows into the table with four distinct values for ID:

TRUNCATE TABLE DEADLOCK;

INSERT INTO DEADLOCK WITH (TABLOCK)
SELECT
  (RN - 1) / 12500
, REPLICATE('Z', 100)
FROM (
       SELECT TOP (50000) ROW_NUMBER()
		OVER (ORDER BY (SELECT NULL)) RN
       FROM master..spt_values t1
       CROSS JOIN master..spt_values t2
	   CROSS JOIN master..spt_values t3
) t
OPTION (MAXDOP 1);

UPDATE STATISTICS DEADLOCK CI__DEADLOCK WITH FULLSCAN;

Running the SELECT query from before with MAXDOP 2 seems to pretty reliably produce a deadlock. The query typically takes around 7 seconds to run at first but it usually finishes much quicker after the deadlock checker has woken up. The deadlock can be seen with the exchange_spill extended event or by the tempdb spill in the repartition streams operator:

a14_deadlock

Putting the Dead in Deadlock

Some queries have extremely variable performance. They can run for seconds, minutes, hours, or even longer than a day. They can eventually be killed by the deadlock monitor. I had one such query running for longer than 24 hours, but apparently Microsoft got embarrassed and killed SSMS:

a14_SSMS

There are many ways to see this behavior. Inserting alternating 0s and 1s seems to do the trick:

TRUNCATE TABLE DEADLOCK;

INSERT INTO DEADLOCK WITH (TABLOCK)
SELECT
  RN % 2
, REPLICATE('Z', 100)
FROM (
       SELECT TOP (100000) ROW_NUMBER()
		OVER (ORDER BY (SELECT NULL)) RN
       FROM master..spt_values t1
       CROSS JOIN master..spt_values t2
	   CROSS JOIN master..spt_values t3
) t
OPTION (MAXDOP 1);

UPDATE STATISTICS DEADLOCK CI__DEADLOCK WITH FULLSCAN;

The first 49000 rows or so are displayed fairly consistently in SSMS. After that the query slows to a crawl. It only used 140 ms of CPU time after five minutes of execution. I wasn’t able to get this query to finish on my machine, but other similar queries finished after many hours. The data in sys.dm_exec_query_profiles is interesting:

a14_dmv

Assuming a packet size of 4500 rows, the scan at node id 8 is just one packet away from finishing. Thread 1 for the repartition streams is finished along with thread 1 of the merge join. All 50k rows with a value of 0 have been processed by the merge join but only 49898 rows made it to the gather streams at the end of the plan. I’ve seen this kind of behavior with the performance issue that affects some parallel queries with a TOP operator.

All six rows from sys.dm_os_waiting_tasks have a wait type of CXPACKET. There are resource descriptions of WaitType=e_waitPortClose. Ultimately, it’s not clear to me why this query appears to run “forever”, but one way or another it should eventually finish.

Final Thoughts

The same behavior can be seen in 2017 RC2. I couldn’t get either of the two example queries to finish on that version. Some of my test cases don’t cause deadlocks in 2016 SP1 CU2. It appears that Microsoft has done work in this area with negative consequences for some data distributions. A theory for why this happens can be found here. Microsoft appears to have fixed this in 2016 SP1 CU6. Thanks for reading!

Dumping Call Stacks

If you’re like me, you’ve seen people posting information found through debugging SQL Server and thought “Yeah, I could be that cool”. If you want to see call stacks but failed to get anywhere with the debugger then this post might be for you. It contains step-by-step instructions for viewing SQL Server call stacks by creating a minidump.

What is a Minidump?

I will borrow a definition from Thomas Kejser’s blog post:

What is a dump? It is a file containing a snapshot of the running process – and parts or all of the memory space of that process. The snapshot also contains the call stack of every thread the process has created.

That last sentence is relevant to our interests. We can use minidumps to generate small files that contain SQL Server call stacks. Note that if you aren’t careful you can end up writing the full contents of memory to a dump file. I believe that writing the file is a single-threaded process, so this can take hours and hundreds of GBs on a real server. Also SQL Server is frozen while the dump is happening, so don’t do it in production.

Dumps are most useful when you want to examine a long running, very simple query or a query that seems to be stuck at a certain point. They aren’t useful to see a full call stack of a non-simple query or to see something that happens just once during execution, like a specific task during query compilation. All that you can get is a snapshot and the snapshot may not contain the information that you’re looking for.

There are multiple ways to generate and read dump files. For this blog post I’ll be using sqldumper.exe and WinDbg.

Using sqldumper.exe

First go to the directory that contains sqldumper.exe. On my machine for SQL Server 2016 the directory is C:\Program Files\Microsoft SQL Server\130\Shared . Open an admin command prompt and point it to that directory. Here are the arguments that we need to look at call stacks:

C:\Program Files\Microsoft SQL Server\130\Shared>sqldumper
Usage: sqldumper [ProcessID [ThreadId [Flags[:MiniDumpFlags] [SqlInfoPtr [DumpDir

There are many ways to get the ProcessID for SQL Server. One way is to run the following SQL query:

SELECT SERVERPROPERTY('PROCESSID');

At the time of writing this post I have a process ID of 2364.

If ThreadId is set to 0 you’ll get information about all threads, including system threads that you might not be interested in. Sometimes you can get everything that you’re interested in by looking at a single thread for serial queries, or at a single thread if a parallel query appears to be throwing too much work at that thread. There’s probably a better way to write this query, but the query that I use to find the thread that I’m interested in is below:

SELECT th.os_thread_id, wta.wait_type
FROM sys.dm_os_threads th
INNER JOIN sys.dm_os_workers w
	ON th.worker_address = w.worker_address
INNER JOIN sys.dm_os_tasks tk
	ON w.task_address = tk.task_address
INNER JOIN sys.dm_os_waiting_tasks wta
	ON wta.waiting_task_address = tk.task_address
where tk.session_id = 56;

wait_type is there to give a clue about which threads are interesting. More columns can be added to the query as needed.

The Flags parameter controls which information is written to the dump file. There are many options and some of them write the full contents of memory to disk. The most useful ones that I’ve found are 0x0120 (dump minimal information about all threads) and 0x0100 (dump information about a single specified thread).

I always set SqlInfoPtr to 0 and don’t care to know what it does.

DumpDir is where the dump files are written to. Point it to your preferred place for leaving dumps, like Erik’s doorstep.

Getting the Call Stack

If your dump is successful then you’ll end up with a .mdmp file. This can be opened with your favorite debugging program. I use WinDbg because there are instructions for it and I generally don’t know what I’m doing. Open the program and go to File -> Open Crash Dump. Open your file and type the magic command:

~*kn

After a short while you’ll see call stack information:

a13_magic

As far as I can tell, you have to close and reopen the program in order to open a new crash dump file. This is unfortunate, but it makes viewing the call stack that much sweeter.

Insert Example

Let’s start with a simple example. How do call stacks differ when inserting into a heap vs a clustered index? For the source data I’ll put 2 GB of pages into a clustered index:

DROP TABLE IF EXISTS dbo.source_ci;

create table dbo.source_ci (
	ID BIGINT NOT NULL,
	FILLER VARCHAR(7777) NOT NULL,
	PRIMARY KEY (ID)
);

INSERT INTO source_ci WITH (TABLOCK)
SELECT TOP (250000)
	ROW_NUMBER() OVER (ORDER BY (SELECT NULL))
	, REPLICATE('Z', 7777)
FROM master..spt_values t1
CROSS JOIN master..spt_values t2;

Here’s the definition for the target table with a clustered index:

DROP TABLE IF EXISTS dbo.target_ci;

create table dbo.target_ci (
	ID BIGINT NOT NULL,
	FILLER VARCHAR(7777) NOT NULL,
	PRIMARY KEY (ID)
);

And here’s the query that I want to get a dump of:

INSERT INTO dbo.target_ci WITH (TABLOCK)
SELECT *
FROM dbo.source_ci WITH (TABLOCK);

I previously wrote the source data to source_ci in order to make the insert query into target_ci as simple as possible. I want to maximize the chances that the call stack associated with the step of inserting rows into the table is present in the dump file. If the query to select the data for the insert is too complicated then I might not get what I’m looking for when I take a snapshot.

I started the insert, identified the thread of interest (8324), and dumped information for the single thread:

C:\Program Files\Microsoft SQL Server\130\Shared>sqldumper 2364 8324 0x0100 0 c:\sql_dumps
Parsed parameters:
    ProcessID = 2364
    ThreadId = 8324
    Flags = 0x100
    MiniDumpFlags = 0x1160
    SqlInfoPtr = 0x0000000000000000
    DumpDir = c:\sql_dumps
    ExceptionRecordPtr = 0x0000000000000000
    ContextPtr = 0x0000000000000000
    ExtraFile = <NULL>
    PatternForExtraFiles = <NULL>
    InstanceName = <NULL>
    ServiceName = <NULL>
Remote process didn't specify a dump file name
Target suspended
Callback type 11 not used
Callback type 15 not used
Callback type 7 not used
MiniDump completed: c:\sql_dumps\SQLDmpr0024.mdmp
Total Buffer pool data pages filtered out: 0 KB
Total Hekaton data pages filtered out: 0 KB
Total Free memory (from non top level allocators) filtered out: 0 KB
Total top level free memory filtered out: 0 KB
Total Log pool memory filtered out: 0 KB
Location of module 'dbghelp.dll' : 'C:\Program Files\Microsoft SQL Server\130\Shared\dbghelp.dll'
File version of module 'C:\Program Files\Microsoft SQL Server\130\Shared\dbghelp.dll' : '6.12:2.633'
Product version of module 'C:\Program Files\Microsoft SQL Server\130\Shared\dbghelp.dll' : '6.12:2.633'
Location of module 'sqldumper.exe' : 'C:\Program Files\Microsoft SQL Server\130\Shared\SqlDumper.exe'
File version of module 'C:\Program Files\Microsoft SQL Server\130\Shared\SqlDumper.exe' : '2015.130:1601.5'
Product version of module 'C:\Program Files\Microsoft SQL Server\130\Shared\SqlDumper.exe' : '13.0:1601.5'
Watson Invoke: No

I did the same thing with a heap target table (with a MAXDOP 1 hint), and diffed the call stacks:

a13_call_stacks

Some of the function names are the same, which makes a lot of sense. We’re reading from the same source table. Of course there are differences as well. For example, for the heap we see sqlmin!CHeapBuild::InsertRow+0x151 and for the clustered index we see sqlmin!CIndBuild::InsertRow+0xd84. That’s pretty neat.

Stuck Query Example

For the next example I’ll use my favorite query that never finishes. First we need to create a few tables:

DROP TABLE IF EXISTS dbo.TestDriver;

CREATE TABLE dbo.TestDriver
(
    n integer NOT NULL,
    n2 integer NOT NULL
);

-- 100k rows
INSERT dbo.TestDriver WITH (TABLOCK) (n, n2)
SELECT TOP (100000)
CHECKSUM(sv1.number, NEWID()), CHECKSUM(sv1.number, NEWID())
FROM master.dbo.spt_values AS SV1
CROSS JOIN master.dbo.spt_values AS SV2
OPTION (MAXDOP 1);

DROP TABLE IF EXISTS dbo.TestCCI;

CREATE TABLE dbo.TestCCI
(
    n integer NOT NULL,
    INDEX ccsi CLUSTERED COLUMNSTORE
);

-- 10 M rows
INSERT dbo.TestCCI WITH (TABLOCK) (n)
SELECT TOP (10 * 1000 * 1000)
CHECKSUM(sv1.number, NEWID())
FROM master.dbo.spt_values AS SV1
CROSS JOIN master.dbo.spt_values AS SV2
CROSS JOIN master.dbo.spt_values AS SV3
OPTION (MAXDOP 1);

The following query seemingly runs forever:

SELECT CA.x
FROM
(
    SELECT TOP (1) n2
    FROM dbo.TestDriver
    ORDER BY n ASC, n2 DESC
) AS T1 (id2)
CROSS APPLY
(
    SELECT COUNT_BIG(*)
    FROM dbo.Test AS T2
    WHERE T2.n <= T1.id2
) AS CA (x);

Viewing a call stack could be helpful once you’ve exhausted the usual ways of trying to figure out why the query isn’t finishing. If I run the query to get thread information I see that os_thread_id 4176 has a wait type of CXPACKET (zzzzz) and os_thread_id 3076 has a wait type of HTBUILD. Time to take a dump:

sqldumper 2364 3076 0x0100 0 c:\sql_dumps

After running the magic command:

ntdll!NtSignalAndWaitForSingleObject+0x14
KERNELBASE!SetHandleCount+0x1f850
sqldk!SOS_Scheduler::Switch+0x106
sqldk!SOS_Scheduler::SuspendNonPreemptive+0xd3
sqlmin!EventInternal<SuspendQueueSLock>::Wait+0x1e7
sqlmin!CSyncPoint::WaitAtNthGate+0x1ac
sqlmin!CSyncPoint::Wait+0x13e
sqlmin!CBpSpillProcessor::Main+0xf8
sqlmin!CBpQScanHashAggNew::BpGetNextBatch+0x52
sqlmin!CQScanBatchHelper::GetRow+0x97
sqlmin!CQScanNLJoinTrivialNew::GetRow+0x12c
sqlmin!CQScanProfileNew::GetRowImp<0>+0x11d
sqlmin!CQScanXProducerNew::GetRowHelper+0x63
sqlmin!CQScanXProducerNew::GetRow+0x15
sqlmin!FnProducerOpen+0x5b
sqlmin!FnProducerThread+0x7a9
sqlmin!SubprocEntrypoint+0x10ab
sqldk!SOS_Task::Param::Execute+0x231
sqldk!SOS_Scheduler::RunTask+0xaa
sqldk!SOS_Scheduler::ProcessTasks+0x3cd
sqldk!SchedulerManager::WorkerEntryPoint+0x2a1
sqldk!SystemThread::RunWorker+0x8f
sqldk!SystemThreadDispatcher::ProcessWorker+0x2de
sqldk!SchedulerManager::ThreadEntryPoint+0x1d8
kernel32!BaseThreadInitThunk+0x14
ntdll!RtlUserThreadStart+0x21

Now you can write even more detailed connect items that will never get fixed!

Final Thoughts

Now you can impress your friends with call stacks, as long as you have easily impressed friends. Thanks for reading!

Dynamic Data Unmasking

Dynamic data masking is a SQL Server 2016 feature to mask sensitive data at the column level from non-privileged users. Hiding SSNs is a common example in the documentation. However, the documentation also gives the following warning:

The purpose of dynamic data masking is to limit exposure of sensitive data, preventing users who should not have access to the data from viewing it. Dynamic data masking does not aim to prevent database users from connecting directly to the database and running exhaustive queries that expose pieces of the sensitive data.

How bad can it be? This post explores how quickly a table of SSNs can be unmasked by a non-privileged user.

Simple Demo

Let’s use a table structure very similar to the example in the documentation:

DROP TABLE IF EXISTS dbo.People;

CREATE TABLE dbo.People (
	PersonID bigint PRIMARY KEY,
	FirstName varchar(100) NOT NULL,
	LastName varchar(100) NOT NULL,
	SSN varchar(11)
		MASKED WITH (FUNCTION = 'default()') NULL
);

INSERT INTO dbo.People
VALUES (1, 'Pablo', 'Blanco','123-45-6789');

Here’s what the data looks like for a privileged user, such as a user with sa:

a12_sa_results

However, if I login with my lowly erik SQL Server login I can no longer see Pablo Blanco’s SSN:

a12_erik_results

Test Data

To make things more interesting let’s load a million rows into the table. SSNs will be randomized but I didn’t bother randomizing the first and last names.

DROP TABLE IF EXISTS dbo.People;

CREATE TABLE dbo.People (
	PersonID bigint PRIMARY KEY,
	FirstName varchar(100) NOT NULL,
	LastName varchar(100) NOT NULL,
	SSN varchar(11)
		MASKED WITH (FUNCTION = 'default()') NULL
);

INSERT INTO dbo.People WITH (TABLOCK)
SELECT TOP (1000000) ROW_NUMBER() OVER (ORDER BY (SELECT NULL))
, REPLICATE('A', 10)
, REPLICATE('Z', 12)
, RIGHT('000' + CAST(ABS(CHECKSUM(NewId())) AS VARCHAR(11)), 3)
	 + '-' + RIGHT('00' + CAST(ABS(CHECKSUM(NewId())) AS VARCHAR(11)), 2)
	 + '-' + RIGHT('0000' + CAST(ABS(CHECKSUM(NewId())) AS VARCHAR(11)), 4)
FROM master..spt_values t1
CROSS JOIN master..spt_values t2;

How quickly can the malicious end user erik decode all of the data? Does he really require a set of exhaustive queries? To make things somewhat realistic, setting trace flags and creating objects is off limits. Only temp tables can be created, since all users can do that.

Decoding the SSN Format

The WHERE clause of queries can be used to infer information about the data. For example, the following query is protected by data masking because all of the action is in the SELECT clause:

SELECT PersonId
, FirstName
, LastName
, CASE LEFT(SSN, 1)
	WHEN '0' THEN '0'
	WHEN '1' THEN '1'
	WHEN '2' THEN '2'
	WHEN '3' THEN '3'
	WHEN '4' THEN '4'
	WHEN '5' THEN '5'
	WHEN '6' THEN '6'
	WHEN '7' THEN '7'
	WHEN '8' THEN '8'
	WHEN '9' THEN '9'
	ELSE NULL
  END D1
FROM dbo.People;

However, the following query will only return the subset of rows with 1 as the first digit in their SSNs:

SELECT PersonId
, FirstName
, LastName
FROM dbo.People
WHERE LEFT(SSN, 1) = 1;

With 90 queries we could get all of the information that we need, but that’s too much work. First we need to verify the format of the SSN in the column. Perhaps it has dashes and perhaps it doesn’t. Let’s say that our malicious end user gets lucky and both of the following queries return a count of one million rows:

SELECT COUNT(*)
FROM dbo.People
WHERE LEN(SSN) = 11;

SELECT COUNT(*)
FROM dbo.People
WHERE LEN(REPLACE(SSN, '-', '')) = 9;

It’s a reasonable assumption that the SSN is in a XXX-XX-XXXX format, even though the data mask doesn’t tell us that directly.

Looping to Victory

Armed with our new knowledge, we can create a single SQL query that decodes all of the SSNs. The strategy is to define a single CTE with all ten digits and to use one CROSS APPLY for each digit in the SSN. Each CROSS APPLY only references the SSN column in the WHERE clause and returns the matching prefix of the SSN that we’ve found so far. Here’s a snippet of the code:

SELECT
	 p.PersonID
       , d9.real_ssn
FROM dbo.People p
CROSS APPLY (
       SELECT TOP 1 d0.DIGIT
       FROM DIGITS d0
       WHERE p.SSN LIKE d0.DIGIT + '%'
) d1 (prefix)
CROSS APPLY (
       SELECT TOP 1 d1.prefix + d0.DIGIT
       FROM DIGITS d0
       WHERE p.SSN LIKE d1.prefix + d0.DIGIT + '%'
) d2 (prefix)

In the d1 derived table the first digit is found. That digit is passed to the d2 derived table and the first two digits are returned from d2. This continues all the way to d9 which has the full SSN. The full query is below:

DROP TABLE IF EXISTS #t;

WITH DIGITS (DIGIT)
AS
(
	SELECT *
	FROM (
		VALUES ('0'), ('1'), ('2'), ('3'), ('4')
	       , ('5'), ('6'), ('7'), ('8'), ('9')
	) v(x)
)
SELECT
	 p.PersonID
       , p.FirstName
       , p.LastName
       , d9.real_ssn
	into #t
FROM dbo.People p
CROSS APPLY (
       SELECT TOP 1 d0.DIGIT
       FROM DIGITS d0
       WHERE p.SSN LIKE d0.DIGIT + '%'
) d1 (prefix)
CROSS APPLY (
       SELECT TOP 1 d1.prefix + d0.DIGIT
       FROM DIGITS d0
       WHERE p.SSN LIKE d1.prefix + d0.DIGIT + '%'
) d2 (prefix)
CROSS APPLY (
       SELECT TOP 1 d2.prefix + d0.DIGIT + '-'
       FROM DIGITS d0
       WHERE p.SSN LIKE d2.prefix + d0.DIGIT + '%'
) d3 (prefix)
CROSS APPLY (
       SELECT TOP 1 d3.prefix + d0.DIGIT
       FROM DIGITS d0
       WHERE p.SSN LIKE d3.prefix + d0.DIGIT + '%'
) d4 (prefix)
CROSS APPLY (
       SELECT TOP 1 d4.prefix + d0.DIGIT + '-'
       FROM DIGITS d0
       WHERE p.SSN LIKE d4.prefix + d0.DIGIT + '%'
) d5 (prefix)
CROSS APPLY (
       SELECT TOP 1 d5.prefix + d0.DIGIT
       FROM DIGITS d0
       WHERE p.SSN LIKE d5.prefix + d0.DIGIT + '%'
) d6 (prefix)
CROSS APPLY (
       SELECT TOP 1 d6.prefix + d0.DIGIT
       FROM DIGITS d0
       WHERE p.SSN LIKE d6.prefix + d0.DIGIT + '%'
) d7 (prefix)
CROSS APPLY (
       SELECT TOP 1 d7.prefix + d0.DIGIT
       FROM DIGITS d0
       WHERE p.SSN LIKE d7.prefix + d0.DIGIT + '%'
) d8 (prefix)
CROSS APPLY (
       SELECT TOP 1 d8.prefix + d0.DIGIT
       FROM DIGITS d0
       WHERE p.SSN LIKE d8.prefix + d0.DIGIT + '%'
) d9 (real_ssn);

On my machine, this query takes an average of 5952 ms to finish. Here’s a sample of the results:

a12_sample_results

Not bad to unmask one million SSNs.

Looping Even Faster to Victory

The LIKE operator is a bit heavy for what we’re doing. Another way to approach the problem is to have each derived table just focus on a single digit and to concatenate them all together at the end. I found SUBSTRING to be the fastest way to do this. The full query is below:

DROP TABLE IF EXISTS #t;

WITH DIGITS (DIGIT)
AS
(
	SELECT *
	FROM (
		VALUES ('0'), ('1'), ('2'), ('3'), ('4')
	       , ('5'), ('6'), ('7'), ('8'), ('9')
	) v(x)
)
SELECT
	 p.PersonID
       , p.FirstName
       , p.LastName
       , d1.DIGIT + d2.DIGIT + d3.DIGIT
		+ '-' + d4.DIGIT + d5.DIGIT
		+ '-' + d6.DIGIT + d7.DIGIT
		+ d8.DIGIT + d9.DIGIT AS real_ssn
	   into #t
FROM dbo.People p
CROSS APPLY (
       SELECT TOP 1 d0.DIGIT
       FROM DIGITS d0
       WHERE SUBSTRING(p.SSN, 1, 1) = d0.DIGIT
) d1 (DIGIT)
CROSS APPLY (
       SELECT TOP 1 d0.DIGIT
       FROM DIGITS d0
       WHERE SUBSTRING(p.SSN, 2, 1) = d0.DIGIT
) d2 (DIGIT)
CROSS APPLY (
       SELECT TOP 1 d0.DIGIT
       FROM DIGITS d0
       WHERE SUBSTRING(p.SSN, 3, 1) = d0.DIGIT
) d3 (DIGIT)
CROSS APPLY (
       SELECT TOP 1 d0.DIGIT
       FROM DIGITS d0
       WHERE SUBSTRING(p.SSN, 5, 1) = d0.DIGIT
) d4 (DIGIT)
CROSS APPLY (
       SELECT TOP 1 d0.DIGIT
       FROM DIGITS d0
       WHERE SUBSTRING(p.SSN, 6, 1) = d0.DIGIT
) d5 (DIGIT)
CROSS APPLY (
       SELECT TOP 1 d0.DIGIT
       FROM DIGITS d0
       WHERE SUBSTRING(p.SSN, 8, 1) = d0.DIGIT
) d6 (DIGIT)
CROSS APPLY (
       SELECT TOP 1 d0.DIGIT
       FROM DIGITS d0
       WHERE SUBSTRING(p.SSN, 9, 1) = d0.DIGIT
) d7 (DIGIT)
CROSS APPLY (
       SELECT TOP 1 d0.DIGIT
       FROM DIGITS d0
       WHERE SUBSTRING(p.SSN, 10, 1) = d0.DIGIT
) d8 (DIGIT)
CROSS APPLY (
       SELECT TOP 1 d0.DIGIT
       FROM DIGITS d0
       WHERE SUBSTRING(p.SSN, 11, 1) = d0.DIGIT
) d9 (DIGIT);

This query runs in an average on 1833 ms on my machine. The query plan looks as you might expect. Each cross apply is implemented as a parallel nested loop join against a constant scan of 10 values. On average each constant scan operator produces roughly 5.5 million rows. This makes sense, since for each loop we’ll need to check an average of 5.5 values before finding a match, assuming perfectly distributed random digits. Here’s a representative part of the plan:

a12_query1

Letting SQL Server do the Work

With nine digits we end up reading almost 50 million values from the constant scan operators. That’s a lot of work. Can we write a simpler query and let SQL Server do the work for us? We know that SSNs are always numeric, so if we had a table full of all billion possible SSNs then we could join to that and just keep the value from the table. Populating a temp table with a billion rows will take too long, but we can simply split up the SSN into its natural three parts and join to those tables. One way to do this is below:

SELECT TOP (100)
	RIGHT('0' + CAST(t.RN AS VARCHAR(10)), 2) NUM
INTO #t_100
FROM
(
	SELECT -1 + ROW_NUMBER()
		OVER (ORDER BY (SELECT NULL)) RN
	FROM master..spt_values t1
	CROSS JOIN master..spt_values t2
) t;

SELECT TOP (1000)
	RIGHT('00' + CAST(t.RN AS VARCHAR(10)), 3) NUM
INTO #t_1000
FROM
(
	SELECT -1 + ROW_NUMBER()
		OVER (ORDER BY (SELECT NULL)) RN
	FROM master..spt_values t1
	CROSS JOIN master..spt_values t2
) t;

SELECT TOP (10000)
	RIGHT('000' + CAST(t.RN AS VARCHAR(10)), 4) NUM
INTO #t_10000
FROM
(
	SELECT -1 + ROW_NUMBER()
		OVER (ORDER BY (SELECT NULL)) RN
	FROM master..spt_values t1
	CROSS JOIN master..spt_values t2
) t;

DROP TABLE IF EXISTS #t;

SELECT
	 p.PersonID
       , p.FirstName
       , p.LastName
       , t1000.NUM
		+ '-' + t100.NUM
		+ '-' + t10000.NUM AS SSN
	into #t
FROM dbo.People p
LEFT OUTER JOIN #t_1000 t1000
	ON SUBSTRING(p.SSN, 1, 3) = t1000.NUM
LEFT OUTER JOIN #t_100 t100
	ON SUBSTRING(p.SSN, 5, 2) = t100.NUM
LEFT OUTER JOIN #t_10000 t10000
	ON SUBSTRING(p.SSN, 8, 4) = t10000.NUM;

The query now runs in an average of 822 ms. Note that I didn’t try very hard to optimize the inserts into the temp tables because they finish almost instantly. Taking a look at the plan, we see a lot of repartition stream operators because the column for the hash join is different for each query:

a12_repartition

Can we go faster?

Batch Mode to the Rescue

With parallel batch mode hash joins we don’t need to repartition the streams of the larger outer result set. I changed the query to only look at the table with 10000 rows to get more consistent and even parallel row distribution on the temp tables. I also added a clustered index on the temp table for the same reason. In addition to that, maybe we can expect joins to be faster with INT join columns as opposed to VARCHAR. With the canonical #BATCH_MODE_PLZ temp table to make the query eligible for batch mode, the query now looks like this:

SELECT TOP (100000)
    ISNULL(CAST(RN AS INT), 0) NUM
INTO #t_10000
FROM
(
    SELECT -1 + ROW_NUMBER()
        OVER (ORDER BY (SELECT NULL)) RN
    FROM master..spt_values t1
    CROSS JOIN master..spt_values t2
) t;

CREATE CLUSTERED INDEX CI ON #t_10000 (NUM);
 
CREATE TABLE #BATCH_MODE_PLZ (
    I INT
    , INDEX C CLUSTERED COLUMNSTORE
);
 
DROP TABLE IF EXISTS #t;
 
SELECT
     p.PersonID
       , p.FirstName
       , p.LastName
       , t1000.NUM
        + '-' + t100.NUM
        + '-' + t10000.NUM AS SSN
    into #t
FROM dbo.People p
LEFT OUTER JOIN #t_10000 t1000
    ON CAST(SUBSTRING(p.SSN, 1, 3) AS INT) = t1000.NUM
LEFT OUTER JOIN #t_10000 t100
    ON CAST(SUBSTRING(p.SSN, 5, 2) AS INT) = t100.NUM
LEFT OUTER JOIN #t_10000 t10000
    ON CAST(SUBSTRING(p.SSN, 8, 4) AS INT) = t10000.NUM
LEFT OUTER JOIN #BATCH_MODE_PLZ ON 1 = 0;

The query now runs in an average of 330 ms. The repartition stream operators are no longer present:

a12_no_repart

It wasn’t clear to me how to speed this query up further. The probe residuals in the hash joins are one target:

a12_probe

These appear because SQL Server cannot guarantee that hash collisions won’t occur. Paul White points out the following:

If the join is on a single column typed as TINYINT, SMALLINT or INTEGER and if both columns are constrained to be NOT NULL, the hash function is ‘perfect’ – meaning there is no chance of a hash collision, and the query processor does not have to check the values again to ensure they really match.

Unfortunately, the probe residual remains even with the right temp table definition and adding explicit casts and non-null guarantees to the SUBSTRING expression. Perhaps the type information is lost in the plan and cannot be taken advantage of.

Final Thoughts

I don’t think that there’s really anything new here. This was mostly done for fun. Decoding a million SSNs in half a second is a good trick and a good reminder to be very careful with expectations around how much security data masking really gives you. Thanks for reading!

The Trillion Row Table

I loaded one trillion rows into a nonpartitioned table just to see what would happen. Spoiler: bad things happen.

Hardware and Table Plan

I did all of my testing on my home desktop which has an i5-4670 CPU (quad core), 5 GB of RAM for SQL Server, and a Samsung SSD 850 EVO 1 TB. Obviously not ideal to do testing like this but it was enough to get the job done. In order to fit a trillion rows into a table I had to use a CCI. Rowstore tables simply don’t offer good enough compression. For example, consider a page compressed heap with nothing but NULL values. One million rows takes up 10888 KB of disk space:

DROP TABLE IF EXISTS dbo.TEST_HEAP;
CREATE TABLE dbo.TEST_HEAP (
ID BIGINT
) WITH (DATA_COMPRESSION = PAGE);

INSERT INTO dbo.TEST_HEAP WITH (TABLOCK)
SELECT TOP (1000000) NULL
FROM master..spt_values t1
CROSS JOIN master..spt_values t2
OPTION (MAXDOP 1);

EXEC sp_spaceused 'TEST_HEAP';

Therefore, such a table with a trillion rows would require around 10 TB of disk space. That won’t fit on a 1 TB HDD, but the better compression of CCIs gives us some options. Ultimately I decided on building completely full rowgroups of 1048576 rows with each rowgroup only storing a single value. Estimating space for the final table is difficult, but we can hopefully get an upper bound using the following code:

DROP TABLE IF EXISTS dbo.TRIAL_BALLOON;
CREATE TABLE dbo.TRIAL_BALLOON (
ID BIGINT,
INDEX CCI_TRIAL_BALLOON CLUSTERED COLUMNSTORE
) 

INSERT INTO dbo.TRIAL_BALLOON WITH (TABLOCK)
SELECT TOP (10 * 1048576) NULL
FROM master..spt_values t1
CROSS JOIN master..spt_values t2
CROSS JOIN master..spt_values t3
OPTION (MAXDOP 1);

EXEC sp_spaceused 'TRIAL_BALLOON';

The table has 776 KB reserved space and 104 KB space for data. In the worst case we might expect the final table to require 75 GB space on disk.

Serial Population Strategy

My strategy for populating the table was to run the same code in four different SQL Server sessions. Each session grabs the next ID from a sequence and does a MAXDOP 1 insert of 1048576 rows into the CCI. With only four concurrent sessions I didn’t expect to run into any locking issues such as the mysterious ROWGROUP_FLUSH wait event. The sequence definition is about as simple as it gets:

DROP SEQUENCE IF EXISTS dbo.CCI_Sequence;
CREATE SEQUENCE dbo.CCI_Sequence AS BIGINT
START WITH 1
INCREMENT BY 1
NO CACHE;

Here’s the code that I used to add rowgroups to the table:

ALTER SERVER CONFIGURATION
SET PROCESS AFFINITY CPU=0;

DECLARE @i BIGINT

SET NOCOUNT ON;

IF EXISTS (SELECT 1 FROM ##stop_table)
BEGIN
	SET @i = 9999999999999;
END
ELSE
BEGIN
	SELECT @i = NEXT VALUE FOR dbo.CCI_Sequence;
END; 

WHILE @i <= 953674
BEGIN
	WITH NUM (n) AS (
	SELECT n
	FROM
	(
	VALUES
	 (@i),(@i),(@i),(@i),(@i),(@i),(@i),(@i)
	,(@i),(@i),(@i),(@i),(@i),(@i),(@i),(@i)
	,(@i),(@i),(@i),(@i),(@i),(@i),(@i),(@i)
	,(@i),(@i),(@i),(@i),(@i),(@i),(@i),(@i)
	) v(n)
	)
	INSERT INTO dbo.BIG_DATA
	SELECT n1.n
	FROM NUM n1
	CROSS JOIN NUM n2
	CROSS JOIN NUM n3
	CROSS JOIN NUM n4
	OPTION (MAXDOP 1);

	IF EXISTS (SELECT 1 FROM ##stop_table)
	BEGIN
		SET @i = 9999999999999;
	END
	ELSE
	BEGIN
		SELECT @i = NEXT VALUE FOR dbo.CCI_Sequence;
	END;
END;

The affinity stuff was to get the work spread out evenly over my four schedulers. Each session was assigned to a different CPU from 0-3. It was also important to run the following in a new session after all four sessions started working:

ALTER SERVER CONFIGURATION
SET PROCESS AFFINITY CPU=AUTO;

It wasn't clear to me why that was needed to get good throughput. Perhaps part of the work of building a compressed rowgroup is offloaded to a system process?

The references to the ##stop_table temp table are just a way to pause the work as needed without skipping numbers in the sequence. I think that the code to generate 1048576 rows is fairly optimized. I did try to optimize it since this code was going to be run over 950000 times, but I still suspect that there was a better way to do it that I missed.

The jobs finished after about 2 days of running on 4 CPUs. That’s a rate of around 86 million rows per core per minute which I was pretty happy with. After the sessions finished I needed to do one final, very nervous, insert into the table:

INSERT INTO dbo.BIG_DATA
SELECT TOP (331776) 953675
FROM master..spt_values t1
CROSS JOIN master..spt_values t2
OPTION (MAXDOP 1);

Running sp_spaceused has never felt so satisfying:

a11_trillion

Under a GB for one trillion rows. Not bad.

Parallel Population Strategy

Taking advantage of natural parallelism within SQL Server may also be a viable method to populate a trillion row table (especially on an actual server), but I didn’t test it fully. In order to get perfect rowgroups, you need round robin parallelism with a driving table that’s a multiple of the query’s MAXDOP. For example, here’s a suitable plan:

a11_CCI_parallel_insert

The Constant Scan contains exactly four rows because I’m running MAXDOP 4. The source CCI has exactly 1048576 rows. The parallel insert happens without a repartition streams so we end up with exactly 1048576 rows on each thread and in each compressed rowgroup. Below is one way to generate such a plan:

DROP TABLE IF EXISTS dbo.SOURCE_CCI;
CREATE TABLE dbo.SOURCE_CCI (
ID BIGINT,
INDEX CCI_SOURCE_CCI CLUSTERED COLUMNSTORE
);

INSERT INTO dbo.SOURCE_CCI WITH (TABLOCK)
SELECT TOP (1048576) 0
FROM master..spt_values t1
CROSS JOIN master..spt_values t2
OPTION (MAXDOP 1);

DROP TABLE IF EXISTS dbo.TRIAL_BALLOON;
CREATE TABLE dbo.TRIAL_BALLOON (
ID BIGINT,
INDEX CCI_TRIAL_BALLOON CLUSTERED COLUMNSTORE
);

INSERT INTO dbo.TRIAL_BALLOON WITH (TABLOCK)
SELECT  driver.n
FROM (
SELECT TOP (4) v.n
FROM (
	VALUES
		(1),(2),(3),(4)
	) v(n)
) driver
INNER JOIN dbo.SOURCE_CCI sc ON sc.ID < driver.n
OPTION (MAXDOP 4, NO_PERFORMANCE_SPOOL);

With nothing else running on my machine I estimate that this method would take about 2 days to complete. The problem is that if one core is busy with something else, such as watching terrible Youtube videos, then the entire insert could be slowed down.

Updating Stats

To do anything interesting on a table we want statistics. Gathering statistics for extremely compressed data can be challenging in SQL Server. That is because the target sampled rate is based on the total size of the table as opposed to the number of rows in the table. Consider an 8 billion row table built in the same way as the one trillion row table above. SQL Server generates the following query to gather sampled stats against the table:

SELECT StatMan([SC0])
FROM (
SELECT TOP 100 PERCENT [ID] AS [SC0]
FROM [dbo].[BIG_DATA] WITH (READUNCOMMITTED)
ORDER BY [SC0]
) AS _MS_UPDSTATS_TBL
OPTION (MAXDOP 1)

You may notice the lack of TABLESAMPLE as well as the MAXDOP 1 hint. To gather sampled stats SQL Server will get all eight billion rows from the table, sort them, and build the statistics object using the eight billion rows. On my machine, this took almost 3 hours to complete and tempdb grew to 85 GB.

There is a trick to get more reasonable sampled stats. All that’s needed is to increase the table size while keeping the same data. Soft deletion of compressed rowgroups is a good way to accomplish this. First find a data distribution that doesn’t compress well in CCIs. Here’s one example:

SELECT 9999999 + SUM(RN) OVER (ORDER BY RN)
FROM (
	SELECT TOP (1048576) ROW_NUMBER()
		OVER (ORDER BY (SELECT NULL)) RN
	FROM master..spt_values t1
	CROSS JOIN master..spt_values t2
) t
OPTION (MAXDOP 1);

Each rowgroup has a size of 8392 KB, so adding 100 rowgroups will add 839200 KB to the table. Deleting all of the newly added rows can take a little while and will log quite a bit to the transaction log, but the table size won’t change. Gathering sampled stats after the insert and delete took just a few seconds. The sample size was about 1% of the table. After a REORG the fully deleted rowgroups will be marked as TOMBSTONE and cleaned up by a background process.

For the one trillion row table I decided to roll the dice and go for sampled stats without any tricks. I gave tempdb a maximum size of 280 GB in order to not completely fill my hard drive. The stats update took 3 hours and 44 minutes. Surprisingly, the stat update grew tempdb to its maximum size but it didn’t fail. Perhaps I got very lucky. Here is the hard earned stats object:

a11_stats_object

Expected Query Performance

I expected reasonably fast query performance for queries designed to take advantage of rowgroup elimination. After all, the table was built in a way such that every compressed rowgroup only has a single value. I can get a count of rowgroups along with some other metadata in 20 seconds using the DMVs:

SELECT COUNT(*), MIN(css.min_data_id), MAX(css.max_data_id)
FROM sys.objects o
INNER JOIN sys.columns c ON o.object_id = c.object_id
INNER JOIN sys.partitions p ON o.object_id = p.object_id
INNER JOIN sys.column_store_segments css
    ON p.hobt_id = css.hobt_id
    AND css.column_id = c.column_id
WHERE o.name = 'BIG_DATA'
AND c.name = 'ID';

Getting the relevant segment_ids for a particular filter finishes in under a second:

SELECT segment_id
FROM sys.objects o
INNER JOIN sys.columns c ON o.object_id = c.object_id
INNER JOIN sys.partitions p ON o.object_id = p.object_id
INNER JOIN sys.column_store_segments css
    ON p.hobt_id = css.hobt_id
    AND css.column_id = c.column_id
WHERE o.name = 'BIG_DATA'
AND c.name = 'ID'
AND 500000 BETWEEN css.min_data_id AND css.max_data_id;

I’m dealing with DMVs so I would expect SQL Server to be able to do rowgroup elimination in a much more efficient way than the above queries. Therefore, 30 seconds seemed like a reasonable upper bound for the following query:

SELECT COUNT(*)
FROM dbo.BIG_DATA
WHERE ID = 500000;

The query takes over 15 minutes to complete despite reading only a single segment:

Table ‘BIG_DATA’. Scan count 4, logical reads 0, physical reads 0, read-ahead reads 0, lob logical reads 6, lob physical reads 1, lob read-ahead reads 0.
Table ‘BIG_DATA’. Segment reads 1, segment skipped 953674.

SQL Server Execution Times:
CPU time = 905328 ms, elapsed time = 917478 ms.

The Evil Wait Event

The query had a max wait time of 915628 ms for QUERY_TASK_ENQUEUE_MUTEX. This is suspiciously close to the elapsed time of 917478 ms. Unfortunately this is a very unpopular wait event in the industry. The wait event library has almost no information about it as well.

I call this the evil wait event because while it’s happening queries cannot be canceled through SSMS and many unrelated queries won’t even run. Most of the time no useful work can be done on the instance. I can’t read Russian so I’m not sure what the wait event is about. After I restarted SQL Server the wait event no longer appeared as consistently, but query performance did not improve as far as I could tell.

Other Queries

I ran a few other tests queries as well, although I was limited in what I could do by the evil wait event. The following query is the only one that I found that wasn’t affected:

SELECT TOP 1 ID
FROM dbo.BIG_DATA;

For reasons I don’t understand the query still took a long time:

Table ‘BIG_DATA’. Scan count 1, logical reads 0, physical reads 0, read-ahead reads 0, lob logical reads 6, lob physical reads 1, lob read-ahead reads 0.
Table ‘BIG_DATA’. Segment reads 1, segment skipped 0.

SQL Server Execution Times:
CPU time = 791625 ms, elapsed time = 811202 ms.

Counting the rows in the table took almost half an hour:

SELECT COUNT_BIG(*)
FROM dbo.BIG_DATA;

Statistics output:

Table ‘BIG_DATA’. Scan count 4, logical reads 0, physical reads 0, read-ahead reads 0, lob logical reads 5722050, lob physical reads 819345, lob read-ahead reads 0.

SQL Server Execution Times:
CPU time = 3734515 ms, elapsed time = 1635348 ms.

A query to sum every ID in the table took over 40 minutes:

SELECT SUM(ID)
FROM dbo.BIG_DATA;

Statistics output:

SQL Server Execution Times:
CPU time = 4810422 ms, elapsed time = 2433689 ms.

As expected performance gets worse without aggregate pushdown. Picking a simple query that’s not supported:

SELECT MAX(ID / 1)
FROM dbo.BIG_DATA;

This query took over an hour:

SQL Server Execution Times:
CPU time = 10218343 ms, elapsed time = 3755976 ms.

Queries against some of the CCIs DMVs don’t do very well either. A simple count took almost ten minutes:

SELECT COUNT(*)
FROM sys.dm_db_column_store_row_group_physical_stats
where OBJECT_ID = OBJECT_ID('BIG_DATA');

All of the work appears to be in the COLUMNSTORE_ROW_GROUPS table-valued function but I didn’t dig any more into it.

If you’re interested in how a query performs let me know in the comments. I will try anything that’s somewhat reasonable.

Final Thoughts

Now I can add working with trillion row tables to my resume. The compression for the one trillion row table was very impressive but everything else was decidedly less impressive. The very long QUERY_TASK_ENQUEUE_MUTEX wait times for nearly all queries were especially disappointing. I plan to do more testing at a later date with a partitioned table to see if that helps at all. Thanks for reading!

Rowgroup Elimination

Rowgroup elimination is a performance optimization based on compressed rowgroup metadata that can allow rowgroups to be skipped during query execution. It’s likely that all of the metadata used for the optimization is exposed in the sys.column_store_segments DMV. This blog post explores some of the less well known rules and limitations for rowgroup elimination.

Test Data

To keep things very simple we’ll build 100 rowgroups with exactly 1 million rows in each of them. ID and ID2 increase from 1 to 10000000 and ID_NULL is always NULL. Code to create and populate the table:

DROP TABLE IF EXISTS dbo.MILLIONAIRE_CCI;

CREATE TABLE dbo.MILLIONAIRE_CCI (
	ID BIGINT NULL,
	ID2 BIGINT NULL,
	ID_NULL BIGINT NULL,
	INDEX CCI_MILLIONAIRE_CCI CLUSTERED COLUMNSTORE
);

DECLARE @loop INT = 0;
BEGIN
	SET NOCOUNT ON;
	WHILE @loop < 100
	BEGIN
		INSERT INTO dbo.MILLIONAIRE_CCI WITH (TABLOCK)
		SELECT t.RN, t.RN, NULL
		FROM (
			SELECT TOP (1000000)
				(1000000 * @loop)
				+ ROW_NUMBER()
					OVER (ORDER BY (SELECT NULL)) RN
			FROM master..spt_values t1
			CROSS JOIN master..spt_values t2
			ORDER BY RN
		) t
		OPTION (MAXDOP 1);

		SET @loop = @loop + 1;
	END;
END;

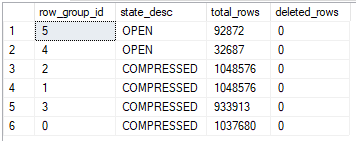
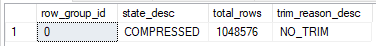
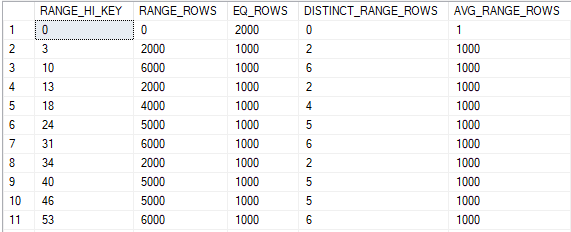
We can expect very good rowgroup elimination on the ID and ID2 columns based on how we built them. That can be verified by calculating the REFF or by looking at sys.column_store_segments:

a10_not_null_DMV

Code to generate the above result set:

SELECT css.min_data_id, css.max_data_id, css.has_nulls
FROM sys.objects o
INNER JOIN sys.columns c ON o.object_id = c.object_id
INNER JOIN sys.partitions p ON o.object_id = p.object_id
INNER JOIN sys.column_store_segments css
    ON p.hobt_id = css.hobt_id
    AND css.column_id = c.column_id
INNER JOIN sys.dm_db_column_store_row_group_physical_stats s
    ON o.object_id = s.object_id
    AND css.segment_id = s.row_group_id
    AND s.partition_number = p.partition_number
WHERE o.name = 'MILLIONAIRE_CCI'
AND c.name = 'ID'
AND s.[state] = 3
ORDER BY css.min_data_id, css.segment_id;

Many of the test queries below select a single aggregate value. This isn’t done for any special reason other than to limit the size of the result set. The easiest way to see how many rowgroups were skipped is to use SET STATISTICS IO ON and that requires that the results be returned to the client.

Single Column Filtering

Consider the following query:

SELECT MAX(ID)
FROM dbo.MILLIONAIRE_CCI
WHERE ID IN (1000000, 2000001);

Based on how we built the segments for the ID column we might expect that only two segments will need to be read: segment 1 with ID values of 1-1000000 and segment 3 with ID values of 2000001-3000000. As usual, SQL Server does not care about our expectations:

Table ‘MILLIONAIRE_CCI’. Segment reads 3, segment skipped 97.

Why did the storage engine scan two segments instead of three? Running another test makes the problem more clear:

SELECT MAX(ID)
FROM dbo.MILLIONAIRE_CCI
WHERE ID IN (1, 100000000);

For this query we end up scanning the entire table:

Table ‘MILLIONAIRE_CCI’. Segment reads 100, segment skipped 0.

It seems as if the query optimizer reduces the predicate against the filtered column to be a range of IDs. That range of IDs is used for rowgroup elimination. In some cases it’s possible to write a WHERE clause that won’t return any rows but still isn’t eligible for rowgroup elimination. The storage engine is not able to skip any segments while executing the below query:

SELECT MAX(ID)
FROM dbo.MILLIONAIRE_CCI
WHERE ID < 0 OR ID > 100000000;

There isn’t an issue when the where clause is filtering on a contiguous range. For example, the following query skips 98 segments as expected:

SELECT MAX(ID)
FROM dbo.MILLIONAIRE_CCI
WHERE ID BETWEEN 1 AND 2000000;

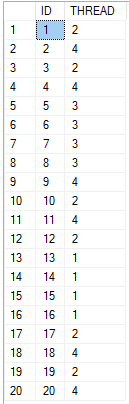
There also isn’t an issue when filtering down to multiple values as long as those values are sufficiently close together, as shown with the first example. I also wasn’t able to find any liminations around the number of values in the IN clause. The query below reads 1 segment and skips 99 as we might hope:

SELECT MAX(l.ID)
FROM dbo.MILLIONAIRE_CCI l
WHERE l.ID IN (
1, 2, 3, 4, 5, 6, 7, 8, 9, 10
, 11, 12, 13, 14, 15, 16, 17, 18, 19, 20
, 21, 22, 23, 24, 25, 26, 27, 28, 29, 30
, 31, 32, 33, 34, 35, 36, 37, 38, 39, 40
, 41, 42, 43, 44, 45, 46, 47, 48, 49, 50
, 51, 52, 53, 54, 55, 56, 57, 58, 59, 60
, 61, 62, 63, 64
);

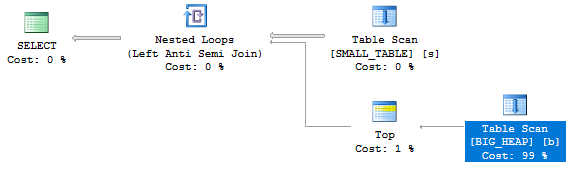
If we add one more filter value then the query optimizer changes the plan to use a join:

a10_part1_to_join

The above query is eligible for rowgroup elimination but it follows slightly different ruless as covered later in this post.

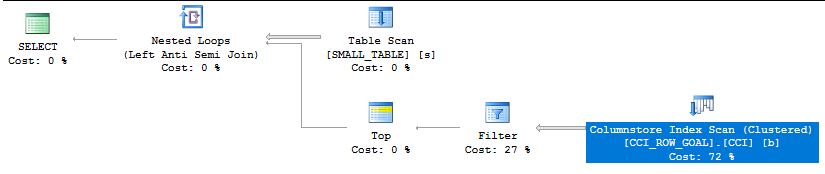
It is possible to disable the transformation to a join by using the undocumented query hint QueryRuleOff SelToLSJ. With 976 entries in the IN clause I still get rowgroup elimination as expected. With 977 entries nothing was pushed to the scan at all, and we get a truly horrible plan:

a10_terrible_plan

This doesn’t appear to be a columnstore limitation. The same behavior can be observed with a clusted rowstore index.

Getting back on track, the internal calculation around which rowgroups to skip isn’t always as simple as calculating the minimum and maximum in the range and using those values to do elimination. It’s possible to end up with no rowgroup elimination even when the maximum and minimum ID in the WHERE clause are close to each other. Consider the following query:

SELECT MAX(ID)
FROM dbo.MILLIONAIRE_CCI
WHERE ID BETWEEN 1 AND 2
OR ID BETWEEN 2 AND 3;

The storage engine only has to read a single segment. We can see in the query plan that the optimizer was able to simplify the expression into something that happens to qualify for rowgroup elimination:

a10_part1_rewrite

Now consider the following query:

SELECT MAX(ID)
FROM dbo.MILLIONAIRE_CCI
WHERE ID BETWEEN 1 AND 2
OR ID BETWEEN 3 AND 4;

It would be helpful if the query optimizer changed the predicate to ID BETWEEN 1 AND 4 when doing calculations around which rowgroups can be skipped. This does not happen, and as a result all 100 rowgroups are scanned. Rowgroup elimination won’t be available when the WHERE clause is a sufficiently complicated mix of AND and OR conditions, even when filtering on just one column.

NULLs

Information about NULLs is stored internally and can be used for rowgroup elimination. SQL Server knows that none of the compressed segments for the ID column contain NULL, so the storage engine can skip all 100 segments for the following query:

SELECT MAX(ID)
FROM dbo.MILLIONAIRE_CCI
WHERE ID IS NULL;

Naturally, reversing the filter for this query will require the storage engine to scan the entire table.

SELECT MAX(ID)
FROM dbo.MILLIONAIRE_CCI
WHERE ID IS NOT NULL;

We might expect that query to skip all segments if we change the filter column to ID_NULL. All rows in the rowgroups for ID_NULL are NULL and SQL Server ought to be aware of that fact. However, the storage engine still scans the entire table even for the query below:

SELECT MAX(ID)
FROM dbo.MILLIONAIRE_CCI
WHERE ID_NULL IS NOT NULL;

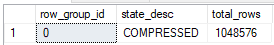
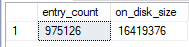
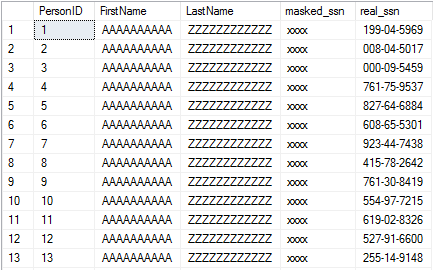
The DMV for ID_NULL doesn’t look as we might expect:

a10_NULL_DMV

sys.column_store_dictionaries has a value of 0 for the entry_count column. It seems likely that the fact that the segments only contain NULL can be deduced from information already tracked by SQL Server. Rowgroup elimination for IS NOT NULL may have not been added because it was thought to be too unlikely of a use case.

Filters on Multiple Columns

To state it simply, rowgroup elimination can work quite well with AND predicates on different columns. It will not work with OR predicates on different columns unless the query optimizer can simplify the expression to something that’s eligible for rowgroup elimination.

The following queries are all able to skip 99 rowgroups:

SELECT MAX(ID)
FROM dbo.MILLIONAIRE_CCI
WHERE ID = 1 AND ID2 = 1;

SELECT MAX(ID)
FROM dbo.MILLIONAIRE_CCI
WHERE ID BETWEEN 1 AND 2
AND ID2 BETWEEN 3 AND 4;

SELECT MAX(ID)
FROM dbo.MILLIONAIRE_CCI
WHERE ID BETWEEN 1 AND 100000000
AND ID2 BETWEEN 1000001 AND 2000000;

This query skips all 100 rowgroups:

SELECT MAX(ID)
FROM dbo.MILLIONAIRE_CCI
WHERE ID = 1 AND ID2 = 1000001;

The storage engine doesn’t take the union of rowgroups that could be relevant. It instead takes the intersection, so adding AND predicates won’t increase the number of segments scanned, unless perhaps if you do something very unreasonable. The following query scans one rowgroup as expected:

SELECT MAX(ID)
FROM dbo.MILLIONAIRE_CCI
WHERE ID BETWEEN 1 AND 100000000
AND ID2 BETWEEN 1000001 AND 2000000
AND ID > ID2;

The final part of the WHERE clause is implemented in a filter operator. The rest of the WHERE clause remains eligible for rowgroup elimination.

Now let’s try a simple query with an OR predicate:

SELECT MAX(ID)
FROM dbo.MILLIONAIRE_CCI
WHERE ID = 1 OR ID2 = 1;

We might hope that the storage engine is able to deduce that only the first segment is relevant. Instead, rowgroup elimination isn’t even attempted. The predicate is implemented as a filter:

a10_FILTER

The only situation with OR filters that I’ve found to work with rowgroup elimination is when the optimizer can eliminate one of them. For example, the following query scans 5 segments because the optimizer is able to eliminate the condition on the ID2 column:

SELECT MAX(ID)
FROM dbo.MILLIONAIRE_CCI
WHERE ID IN (1, 5000000) OR ID2 BETWEEN 1 AND 0;

Joins

The query optimizer is able to copy predicates when filtering and joining on the same column. The copied predicates are eligible for rowgroup elimination. Consider the query below:

SELECT MAX(l1.ID)
FROM dbo.MILLIONAIRE_CCI l1
INNER JOIN dbo.MILLIONAIRE_CCI l2 ON l1.ID = l2.ID
WHERE l1.ID BETWEEN 1 AND 1000000;

Only two segments are read because the filter on ID can be applied to both sides of the join. The same behavior can be observed when forcing a merge join. Loop join is a bit different. As covered in the post on CCI string aggregation, rowgroup elimination does not occur on the inner side of a loop. Consider the following query:

SELECT MAX(l1.ID)
FROM dbo.MILLIONAIRE_CCI l1
INNER JOIN dbo.MILLIONAIRE_CCI l2 ON l1.ID = l2.ID
WHERE l1.ID BETWEEN 1 AND 1000
OPTION (LOOP JOIN, NO_PERFORMANCE_SPOOL);

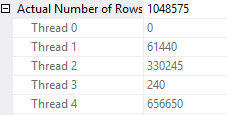
The inner side is scanned 1000 times and the outer side is scanned once. The filter on ID allows all segments to be skipped besides one. So we should read 1001 segments and skip 1001 * 100 – 1001 = 99099 segments. This is what happens:

Table ‘MILLIONAIRE_CCI’. Segment reads 1001, segment skipped 99099.

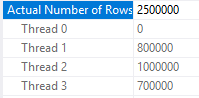
More segments will be read depending on how many rowgroups the filter crosses. Suppose that we include rows with an ID that’s between 999501 and 1000500:

SELECT MAX(l1.ID)
FROM dbo.MILLIONAIRE_CCI l1
INNER JOIN dbo.MILLIONAIRE_CCI l2 ON l1.ID = l2.ID
WHERE l1.ID BETWEEN 999501 AND 1000500
OPTION (LOOP JOIN, NO_PERFORMANCE_SPOOL);

Now each scan on both the inner and outer side will need to read two segments:

Table ‘MILLIONAIRE_CCI’. Segment reads 2002, segment skipped 98098.

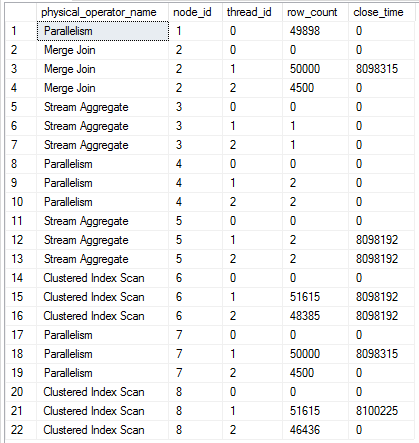
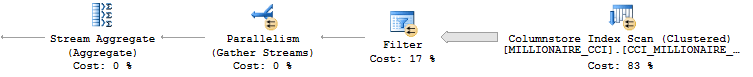
It’s possible to get rowgroup elimination even when filtering and joining on different columns. Consider the following query that joins on ID but filters on ID2:

SELECT MAX(l1.ID)
FROM dbo.MILLIONAIRE_CCI l1
INNER JOIN dbo.MILLIONAIRE_CCI l2 ON l1.ID = l2.ID
WHERE l1.ID2 BETWEEN 1 AND 1000000;

We still get rowgroup elimination against both sides of the join:

Table ‘MILLIONAIRE_CCI’. Segment reads 2, segment skipped 198.

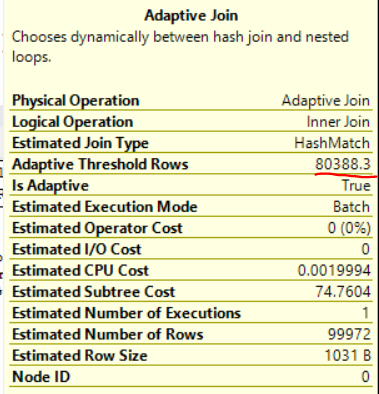
The key is the optimized bitmap:

a10_opt_bitmap

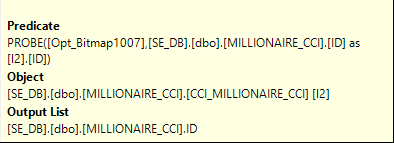
That allows rowgroup elimination to happen on both sides. Bitmap optimization can only occur with hash joins, so queries written in this way that do a merge or loop join won’t be able to take advantage of rowgroup elimination against both tables.

Less Reasonable Queries

Below is a set of sometimes unreasonable queries to test some of the limits around rowgroup elimilation. It was surprising how often the queries remained eligible for rowgroup elimination. For example, local variables seem to cause no issues, even without PEO. The following query reads just one segment:

DECLARE @ID_FILTER BIGINT = 1;
SELECT MAX(ID)
FROM dbo.MILLIONAIRE_CCI
WHERE ID = @ID_FILTER;

Data type conversions on the filtered expression don’t make the query ineligible for rowgroup elimination:

SELECT MAX(ID)
FROM dbo.MILLIONAIRE_CCI
WHERE ID = '1';

Casting on the filtered column is going to prevent rowgroup elimination. As will “optimizer tricks” like adding zero to the column:

SELECT MAX(ID)
FROM dbo.MILLIONAIRE_CCI
WHERE ID + 0 = 1;

We read all rowgroups:

Table ‘MILLIONAIRE_CCI’. Segment reads 100, segment skipped 0.

The query below is eligible for rowgroup elimination:

SELECT MAX(ID)
FROM dbo.MILLIONAIRE_CCI
WHERE ID <= CEILING(RAND());

Using scalar UDFs in queries is a terrible idea, but let’s create one for testing purposes:

CREATE OR ALTER FUNCTION dbo.CHEAP_UDF() RETURNS BIGINT
AS
BEGIN
	RETURN 1;
END;

As you might expect, the following query runs without parallelism and cannot skip any segments:

SELECT MAX(l.ID)
FROM dbo.MILLIONAIRE_CCI l
WHERE l.ID = dbo.CHEAP_UDF();

However, if we add SCHEMABINDING to the function definition then we get rowgroup elimination:

Table ‘MILLIONAIRE_CCI’. Segment reads 1, segment skipped 99.

The query below gets rowgroup elimination with and without SCHEMABINDING:

SELECT MAX(l.ID)
FROM dbo.MILLIONAIRE_CCI l
WHERE l.ID = (SELECT MAX(dbo.CHEAP_UDF()));

Query Rewrites for Better Rowgroup Elimination

In some cases it’s possible to rewrite queries to get better rowgroup elimination. This requires knowing your data and awareness of the rules around rowgroup elimination. Going back to an earlier example, the following query isn’t eligible for rowgroup elimination (without very convenient constraints):

SELECT *
FROM dbo.MILLIONAIRE_CCI
WHERE ID = 1 OR ID2 = 1;

It can be written to use UNION or UNION ALL. Here’s the UNION query:

SELECT *
FROM dbo.MILLIONAIRE_CCI
WHERE ID = 1

UNION 

SELECT *
FROM dbo.MILLIONAIRE_CCI
WHERE ID2 = 1;

Now the storage engine skips 198 segments and only reads 2:

Table ‘MILLIONAIRE_CCI’. Segment reads 2, segment skipped 198.

In some cases it may be advantageous to avoid the sort. The query below has the same rowgroup elimination:

SELECT *
FROM dbo.MILLIONAIRE_CCI
WHERE ID = 1

UNION ALL

SELECT *
FROM dbo.MILLIONAIRE_CCI
WHERE ID2 = 1 AND ID <> 1;

Here’s the query plan:

a10_section_rewrite_UNION_ALL

Consider another query with a wide range of values in the IN clause, but filtered against a single column. The query below won’t be able to skip any rowgroups because we’re including the minimum and maximum value of ID in the query’s results:

SELECT *
FROM dbo.MILLIONAIRE_CCI
WHERE ID IN (
1, 2, 3, 4, 5, 6, 7, 8, 9, 10
, 100000000
);

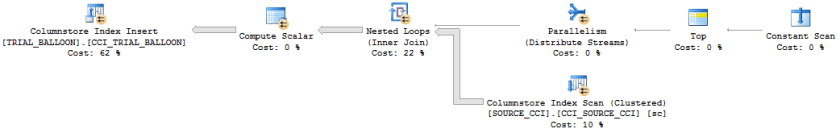
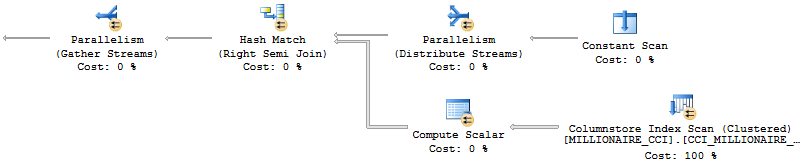
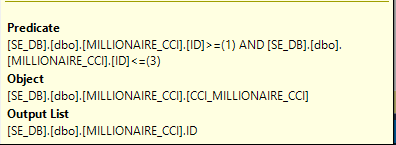
It may be impractical to write out the query using UNION. Instead, we can essentially force a join by putting the filter values into a derived table. The optimizer is likely to move the IN list to a constant scan and do a hash join to the CCI. We can get rowgroup elimination through the bitmap filter on the hash join. Here’s one way to rewrite the query:

SELECT c.*
FROM
(
	VALUES (1), (2), (3), (4), (5)
	, (6), (7), (8), (9), (10)
	, (100000000)
) v(x)
INNER JOIN dbo.MILLIONAIRE_CCI c ON c.ID = v.x;

Here’s the plan:

a10_section_rewrite_hash

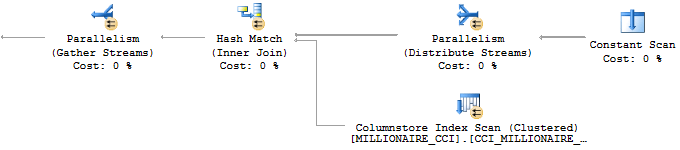
As expected, we only need to scan 2 rowgroups:

Table ‘MILLIONAIRE_CCI’. Segment reads 2, segment skipped 98.

SQL Server 2017 Changes

I ran all of the test queries against SQL Server 2017 RC2. I was not able to observe any differences. It may be that Microsoft did not choose to make improvements in this area, or any improvements were missed by my test cases.

Final Thoughts

Rowgroup elimination seems designed to reduce IO requirements for queries that filter against contiguous ranges against a column, like filtering against a single month of data from a table, or when joining to the CCI through a hash join. It’s possible to write queries for which rowgroup elimination does not occur, even though SQL Server in theory has all of the information that it would need to perform rowgroup elimination. From a practical point of the view, the biggest limitation is probably around OR logic. Thanks for reading!